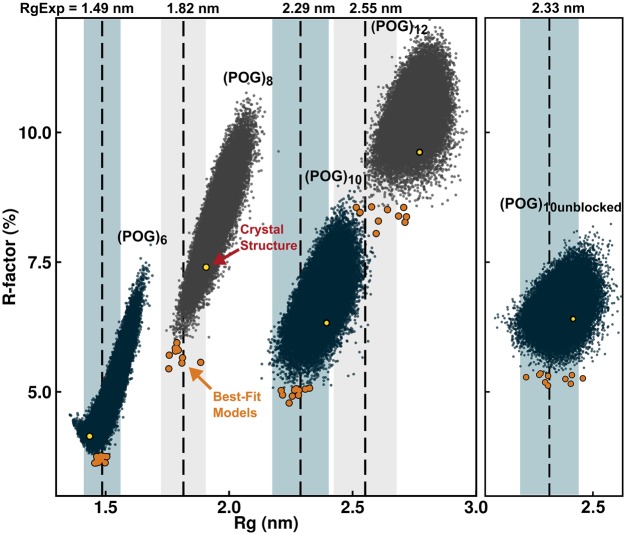
Figure 4. Comparison of the (POG)6-(POG)12 molecular dynamics ensembles with the X-ray scattering curves.
The scattering curves I(Q) were calculated for each of the 50 000 structures created in the five molecular dynamics ensembles for (POG)6-(POG)12, following which the R factor and Rg values for each structure were plotted. The dashed lines represent the experimental Rg values for (POG)6-(POG)12, and the shaded bands represent a ±5% error range in the Rg values. For each of the 50 000 structures, the ten best-fit structures with lowest R factors are shown in orange. The values for the four linear crystallographic models are shown in yellow.

