
Figure 5. Overlap of the linear and best-fit modelled I(Q) curves for (POG)6-(POG)12 onto the X-ray scattering curves.
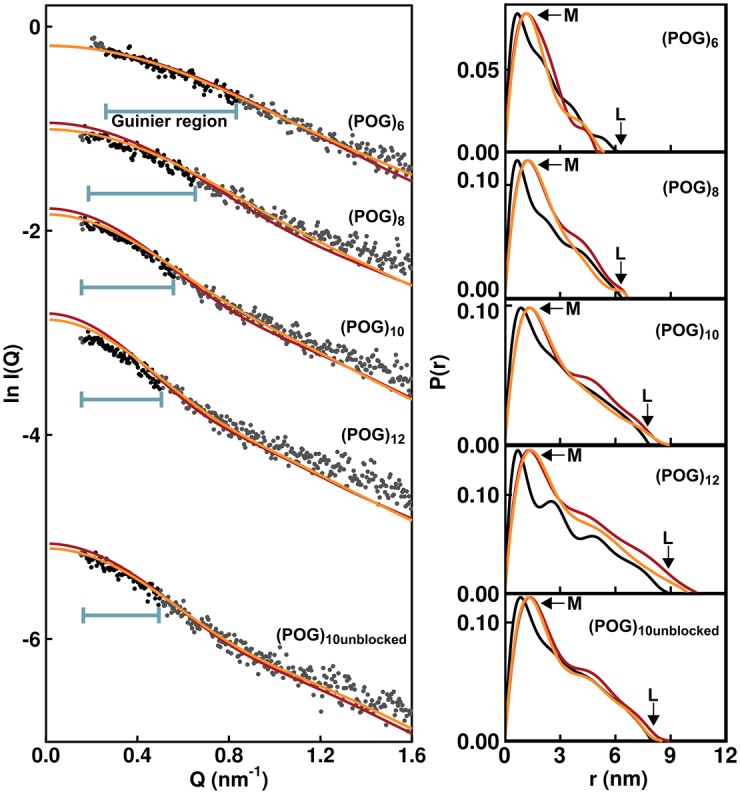
The experimental I(Q) curves (black and grey circles) are compared with the MD best-fit (orange) and linear crystal-derived (red) modelled I(Q) curves for (POG)6-(POG)12. The horizontal bars indicate the region of each curve used to determine the Rg values from Guinier analysis. The vertical axis is measured in arbitary units of ln l(Q). The right-hand panels show the overlaid pair distribution analyses of the experimental I(Q) curves (black), crystal-derived structure (red) and best-fit MD structure (orange).