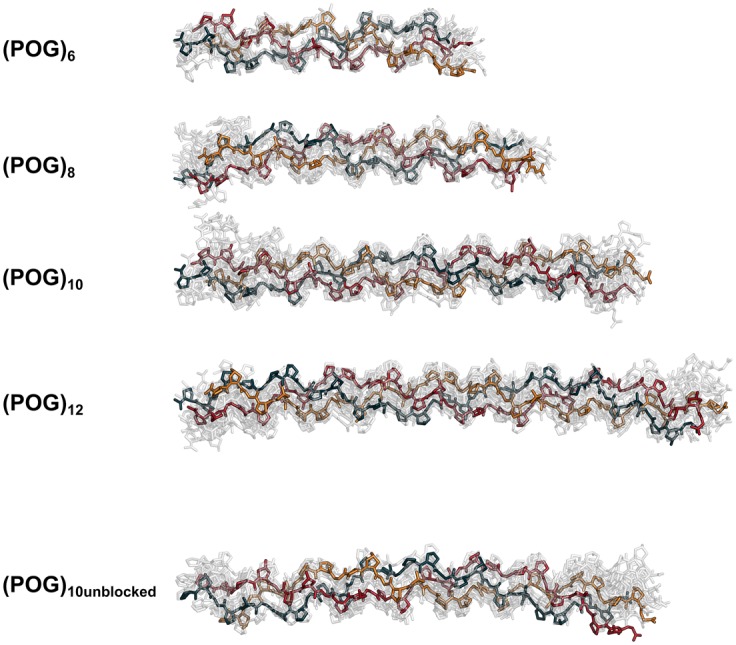
Figure 7. Superimposition of the ten best-fit structures for (POG)6-(POG)12.

Stick representations of the ten best-fit models from each scattering fit analysis were superimposed upon each other. The best-fit structure in each is opaque, with each polypeptide chain represented in blue, red and orange. The remaining nine structures were rendered semi-transparent. Hydrogen atoms were not shown for reason of clarity.
