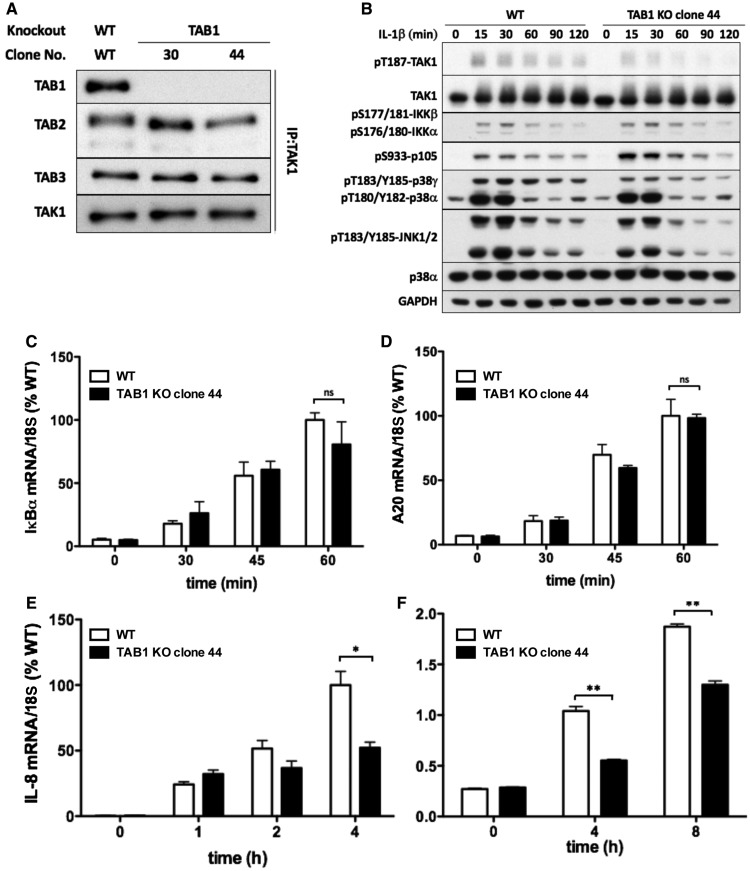
Figure 5. IL-1β signaling in TAB1 KO IL-1R* cells.
(A) Generation of two clones of TAB1 KO IL-1R* cells. Other details are as in Figure 1A. (B) WT IL-1R* cells and TAB1 KO cells (clone 44) were stimulated for up to 2 h with IL-1β . Cell extracts were denatured in SDS, subjected to SDS–PAGE and immunoblotted with the antibodies indicated. (C–E) As in B, except that RNA was extracted from the cells at the times indicated and the formation of IκBα (C), A20 (D) and IL-8 (E) mRNA was measured by qRT-PCR relative to 18S ribosomal mRNA and normalized to the level found in WT cells stimulated with IL-1β. The results are presented as arithmetic mean ± SEM for three independent experiments, each performed in triplicate. (F) As in E, except that IL-8 secreted into the culture medium was measured by ELISA.

