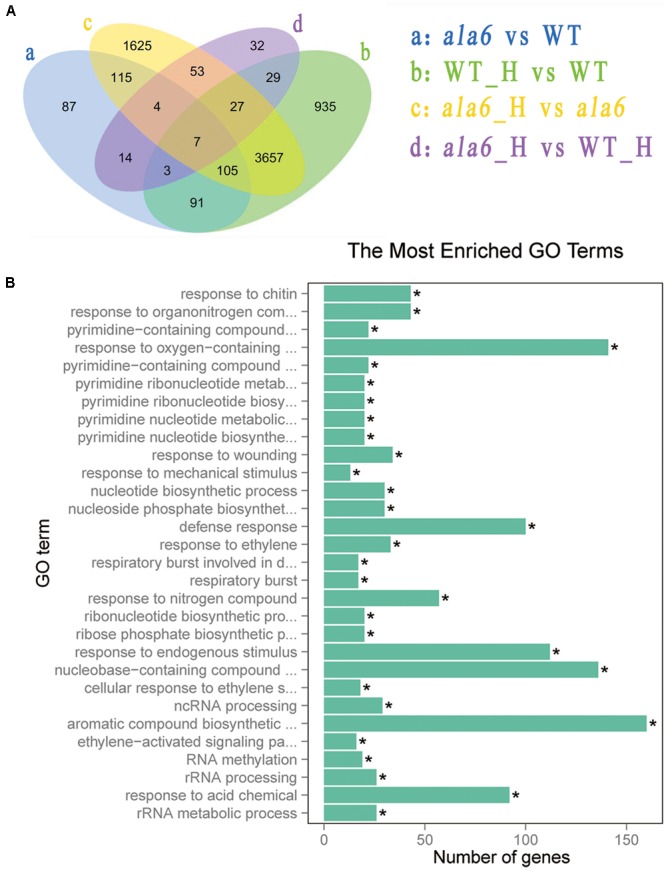
FIGURE 6.

Differentially expressed genes after basal thermotolerance. (A) Venn diagram indicates DEGs. DEGs for a: ala6 vs. WT; b: WT with heat treatment vs. WT; c: ala6 with heat treatment vs. ala6; d: ala6 with heat treatment vs. WT with heat treatment. (B) GO enrichment for DEGs.
