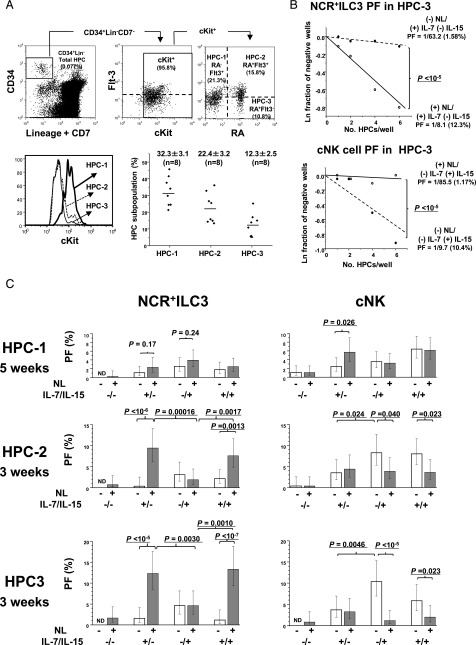
FIGURE 4.
NCR+ILC3 and cNK cell commitments of three different HPC subpopulations. (A) Gating strategy of three HPC subpopulations and their c-Kit expression levels. CD34+Lin−CD7−c-Kit+ PB HPCs were gated into three subpopulations based on the expression levels of Flt-3 and CD45RA (RA): RA−Flt-3+ (HPC-1), RA+Flt-3+ (HPC-2), and RA+Flt-3− (HPC-3) (upper). The expression levels of c-Kit in each subpopulation are represented in a histogram (lower left). The frequencies (%) of the three HPC subpopulations in total HPCs are shown for eight donors (lower right). (B) Representative LDA plots for NCR+ILC3 PFs (upper) and cNK PFs (lower) of HPC-3 subpopulation. Different numbers of HPC-3 cells were sorted into the wells of 384-well plates and cultured in the presence or absence of Notch signaling with IL-7 and/or IL-15 for 3 wk. PFs and percentages are shown, as described in the legend for Fig. 3B. The p values of the differences in PFs between (+)NL (○) and (−)NL (●) conditions were calculated by online analysis using ELDA software (36). (C) NCR+ILC3 and cNK PFs of different HPC subpopulations under different culture conditions of Notch signaling and cytokines (3 or 5 wk culture). The PFs for the HPC-1, HPC-2, and HPC-3 subpopulations were obtained by LDA. The bars represent the 95% confidence intervals of PFs. The p values of the differences in PFs between the two different culture conditions are presented. Similar results were obtained for the other three donors. ND, not detectable due to no positive wells in LDA.

