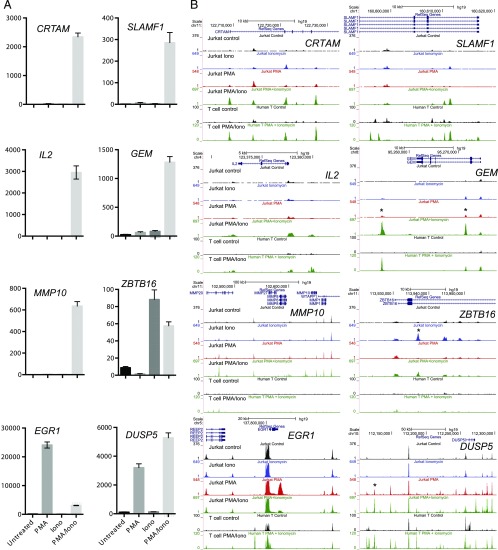
FIGURE 3.
Representative gene expression patterns and corresponding chromatin changes. (A) Bar graphs of individual gene expression patterns determined by RNA-seq and measured in fragments per kilobase of transcript per million mapped reads. Error bars indicate SDs based on triplicates. Shown are representative patterns observed in the data. (B) University of California Santa Cruz Genome Browser shots of the ATAC-seq patterns present in Jurkat T cells for different gene loci following treatment with 20 ng/ml PMA, 1 μg/ml ionomycin, or PMA and ionomycin (20 ng/ml PMA/1 μg/ml ionomycin) for 3 h, and DNase-seq profiles of human T lymphoblastoid cells before and after treatment with 20 ng/ml PMA plus 2 μM calcium ionophore A23187 for 5 h.

