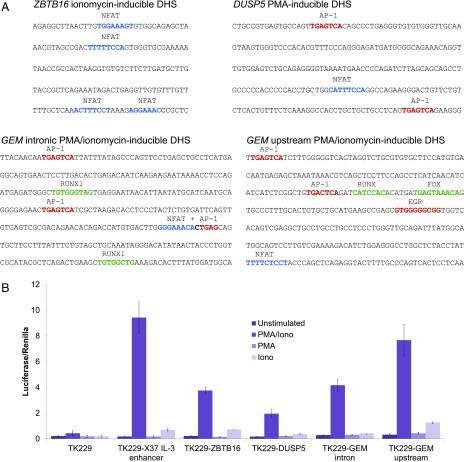
FIGURE 4.
Analyses of sequences found at inducible ATAC peaks. (A) Inducible NFAT, AP-1, and or EGR binding motifs are present in the sequences corresponding to stimulus-specific ATAC-seq peaks. Shown are the analyses of inducible ATAC peaks from the PMA/ionomycin-inducible GEM locus, the ionomycin-inducible ZBTB16 locus, and the PMA-inducible DUSP5 locus (corresponding peaks marked by asterisks in Fig. 3B). (B) Luciferase reporter gene analysis of inducible enhancer function for the above sequences from ZBT16, DUSP5, and GEM genes, plus the inducible human −37 kb IL-3 gene enhancer (16) used in this study as a positive control.

