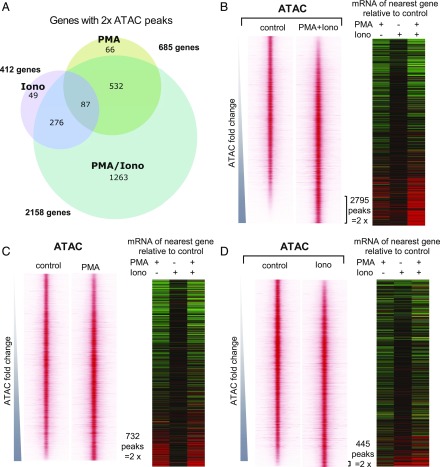
FIGURE 5.
PMA and/or ionomycin treatments induce distinct chromatin changes. (A) Venn diagram showing differential chromatin regulation in Jurkat T cells treated with PMA (20 ng/ml), ionomycin (1 μg/ml), or PMA and ionomycin (20 ng/ml PMA/1 μg/ml ionomycin) cotreatment. Shown are the numbers of genes associated with ATAC-seq peaks that are upregulated by >2-fold by each condition relative to untreated cells. (B–D) Profiles of the ATAC-seq signals within 2-kb windows centered on each peak for PMA/ionomycin (B), PMA (C), and ionomycin (D), aligned with the mRNA expression levels (fold change relative to the untreated control) of the nearest gene (defined by the proximity between ATAC-seq peak and the nearest transcription start site). Window-centered analysis includes the union of all peaks present in each treatment. Peaks are displayed in the order of increasing ATAC-seq signal for each treatment relative to the untreated control. All Jurkat T cell ATAC peak data are available in Supplemental Table III, which lists the averages of three independent ATAC values, and the fold change in response to specific stimuli.

