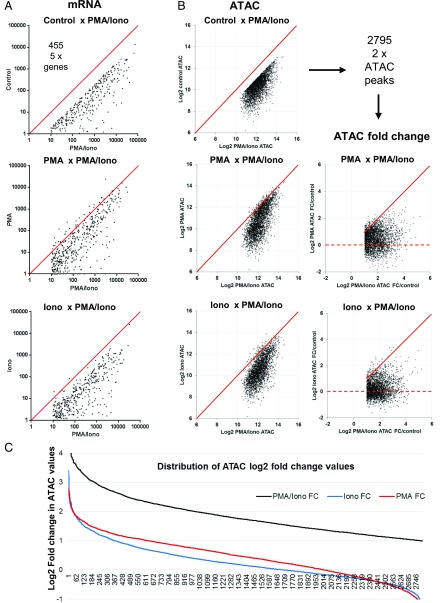
FIGURE 6.
PMA/ionomycin-induced gene expression patterns are correlated with chromatin changes. (A) Comparison of individual inducible reponses to the single and combined stimuli for each of the 455 genes upregulated (by 5-fold) by PMA/ionomycin cotreatment (as defined in Fig. 2B). Shown are scatter plots of individual gene expression values across different treatment conditions. A line representing identical values is shown in red. (B) Differential analysis of the 2795 ATAC-seq peaks that were induced by PMA and ionomycin cotreatment by 2-fold (as defined in Fig. 4A). Shown are scatter plots of individual ATAC-seq peak values across different treatment conditions. Data are represented either as peak intensity or fold change (FC) in log2 scale. A line representing identical values is shown in red. The broken line indicates the level of no fold change. (C) Distribution of ATAC-seq peak values across different treatment conditions (in log2).

