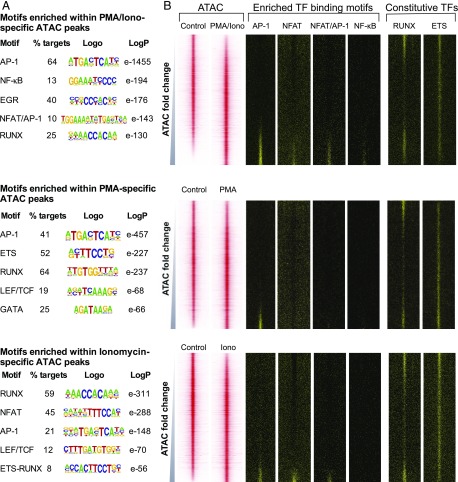
FIGURE 7.
Differential regulation of the chromatin landscape. (A) Result of de novo TF binding motif search of PMA-specific (top), ionomycin-specific (middle), or PMA/ionomycin-specific (bottom) ATAC-seq peaks using HOMER. Top motifs characterized by the fraction of peaks present (per treatment), sequence logo, and p value for enrichment (versus randomized sequence control) are shown. (B) Profiles of the ATAC-seq signals within each 2-kb window centered on each peak for PMA, ionomycin, and PMA/ionomycin aligned with the locations of the specific TF binding motifs. Window-centered analysis includes the union of all peaks present in each treatment, with peaks displayed in order of increasing ATAC-seq signal for each treatment relative to the control.

