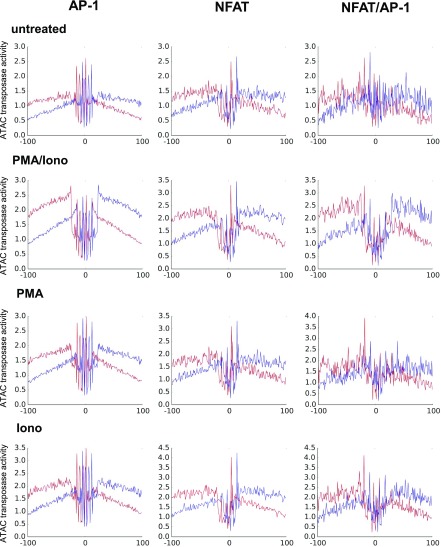
FIGURE 8.
Digital genomic footprinting analyses (63) showing occupancy at genomic coordinates of AP-1, NFAT, and composite NFAT/AP-1 motifs identified in 2-fold–induced ATAC peaks in untreated Jurkat cells and Jurkat cells stimulated with PMA plus ionomycin, PMA alone, or ionomycin alone. Upper strand reads are shown in red and lower strand reads are shown in blue.

