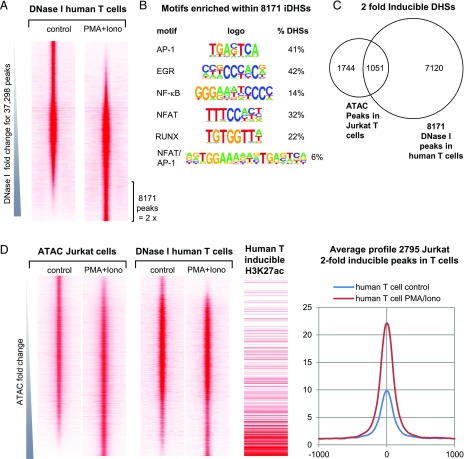
FIGURE 9.
DHS analyses of human T cells stimulated with PMA and calcium ionophore. (A) DNase-seq profiles of actively dividing human T blast cells before and after stimulation with PMA and A23187, ranked in order of increasing inducibility. (B) Results of de novo TF binding motif search for the 8171 DHS peaks induced 2-fold in human T blast cells determined using HOMER. (C) Venn diagram showing the overlap between 8171 DHS peaks induced 2-fold in human T blast cells compared with 2795 ATAC peaks induced 2-fold in Jurkat T cells. (D) Side-by-side comparison of profiles of DHS peaks present in stimulated human T blast cells on the same axis alongside the Jurkat T cell ATAC peaks ranked as in Fig. 7B for Jurkat cells stimulated with PMA and ionomycin. Also shown alongside are 1) the locations of inducible histone H3K27Ac regions as identified from published data from resting and stimulated human CD4 T cells (66), and 2) the average profiles for the 2795 peaks defined as inducible in Jurkat cells in (D) using values from human T blast cells before and after stimulation with PMA and A23187 as in (A).

