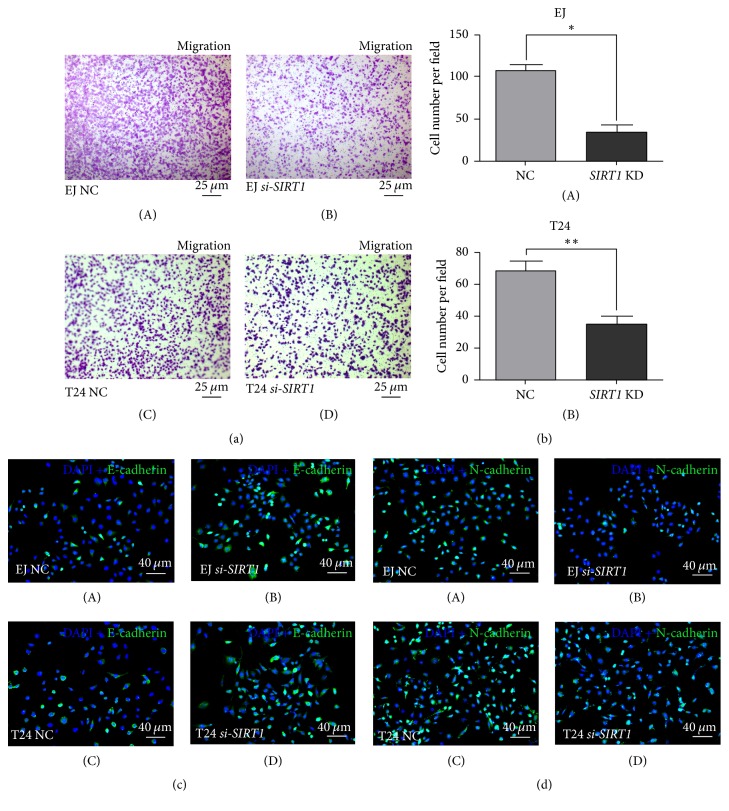
Figure 4.
SIRT1 deficiency inhibited migration of BCa cells. (a) Transwell migration assay was conducted to measure the migration ability of NC group cells (A, C) and si-SIRT1 group cells (B, D) in EJ (contaminated by T24 as per “http://iclac.org/databases/cross-contaminations/”) and T24 for 48 h after transfection. (b) BCa cells in transwell migration assay were counted on microscope and statistically analyzed. All shown values were mean ± SD of three measurements and repeated three times with similar results. ∗p < 0.05; ∗∗p < 0.01. (c) Representative result of immunofluorescence staining of E-cadherin (green) in the BCa cells after SIRT1-target-specific-siRNA treatment (KD) (B, D), compared with control-siRNA treatment (NC) (A, C). Nuclei (blue) were stained by DAPI. The scale bar for (D) is 40 μm. (d) Representative result of immunofluorescence staining of N-cadherin (green) in the BCa cells after SIRT1-target-specific-siRNA treatment (KD) (B, D), compared with control-siRNA treatment (NC) (A, C). Nuclei (blue) were stained by DAPI. The scale bars for (a) are 25 μm and for (c-d) are 40 μm.

