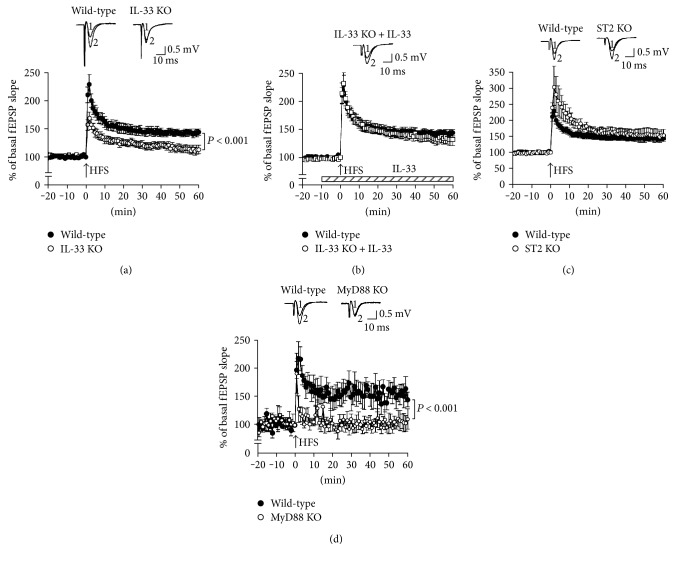
Figure 2.
Schaffer collateral/CA1 LTP. fEPSPs were monitored in the CA1 region of hippocampal slices from wild-type mice (wild-type), IL-33-deficient mice (IL-33 KO) in the absence and presence of IL-33 (1 ng/mL) (a, b), ST2-deficient mice (ST2 KO) (c), and MyD88-deficient mice (MyD88 KO) (d) before and after HFS. In the graphs, each point represents the mean (±SEM) percentage of basal EPSP slope (0 min) (n = 6–13 independent experiments). P values, ANOVA followed by Fisher's PLSD test.

