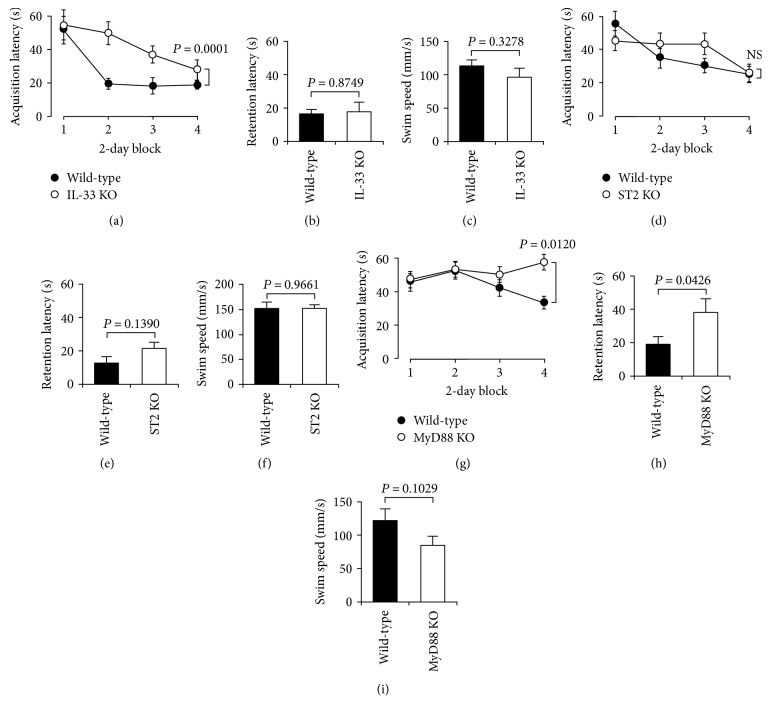
Figure 3.
Water maze test. The water maze task was performed two trials per day for 8 consecutive days, and the acquisition latency was measured in wild-type mice (wild-type), IL-33-deficient mice (IL-33 KO), ST2-deficient mice (ST2 KO), and MyD88-deficient mice (MyD88 KO). Seven days later, the retention latency was measured. In addition, swim speed was calculated in each trial. (a, d, g) In the graphs, each point represents the mean (±SEM) acquisition latency from 2 consecutive days (n = 6-7 independent mice). P values, ANOVA followed by Fisher's PLSD test. NS: not significant. (b, e, h) In the graphs, each column represents the mean (±SEM) retention latency (n = 6-7 independent mice). P values, unpaired t-test. (c, f, i) In the graphs, each column represents the mean (±SEM) swim speed (n = 6-7 independent mice). P values, unpaired t-test.

