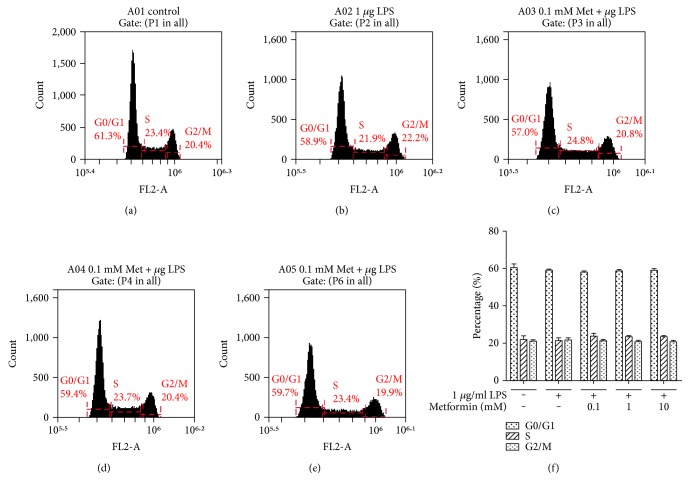
Figure 5.
Metformin effects on cell cycle. HEK294/TLR4 cells were treated with different concentrations of metformin for 24 hours, followed by incubation with 1 μg/ml LPS for 24 hours. The cells were then washed and fixed. Nucleus was stained with PI. Cell cycle was assessed by using flow cytometer. Representative results in (a) control, (b) 1 μg/ml LPS, (c) 0.1 mM metformin and 1 μg/ml LPS, (d) 1 mM metformin and 1 μg/ml LPS, and (e) 10 mM metformin- and 1 μg/ml LPS-treated cells. (f) Histogram of cell cycle data. Data are reported as mean ± SEM.

