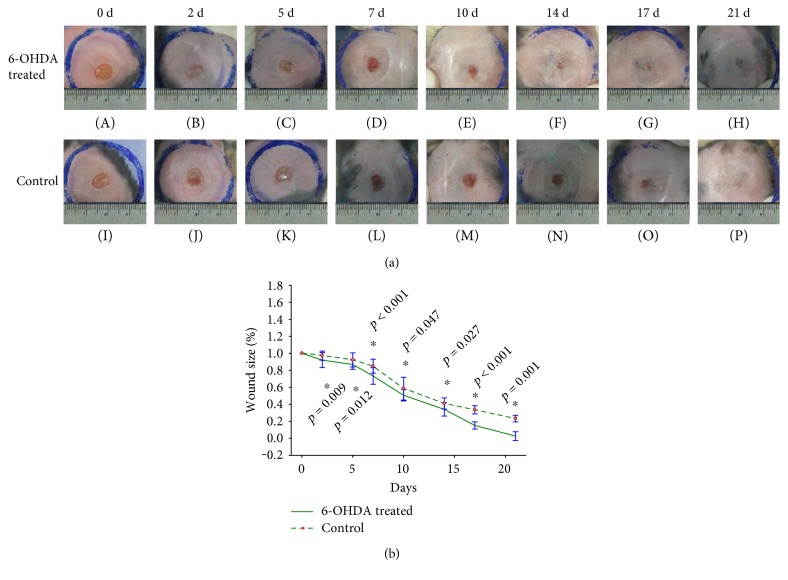
Figure 1.
Wound size in 6-OHDA-treated and control groups after the establishment of full-thickness wounds in diabetic mice. (a) Wound size at different time points in the 6-OHDA-treated group (A–H) and the control group (I–P). (b) Significant differences in wound size in the 6-OHDA-treated group and the control group after the establishment of full-thickness wounds in diabetic mice. ∗p < 0.05, 6-OHDA-treated versus control.

