Figure 2.

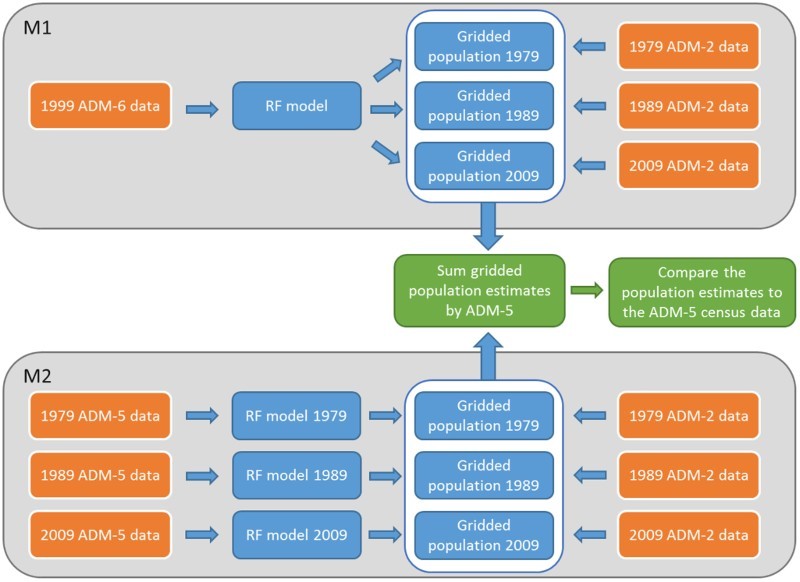
Flow diagram showing the processing steps used to compare the two models M1 and M2, including input census data in orange boxes, model outputs in blue boxes and validation steps in green boxes.

Flow diagram showing the processing steps used to compare the two models M1 and M2, including input census data in orange boxes, model outputs in blue boxes and validation steps in green boxes.