
Figure 5.
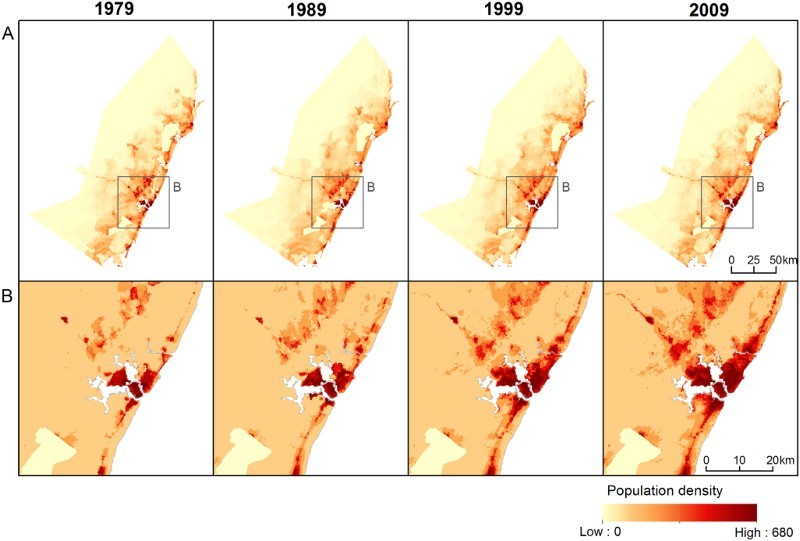
Predicted population density in the coastal districts of Kenya for the four census years (1979, 1989, 1999 and 2009) using M1 for (a) the whole study area and (b) close-ups around Mombasa. Grid cell resolution is 3 arc seconds, or ∼100 m at the equator, and grid cell values represent people per hectare.