
Figure 2.
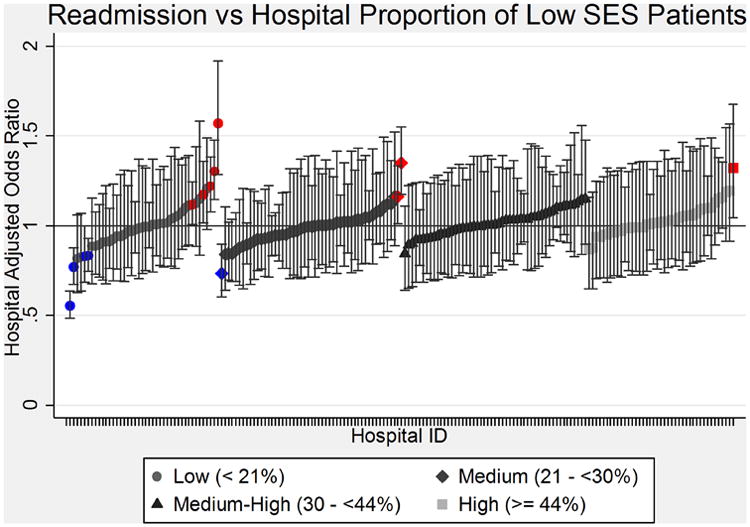
Hospital 30-day readmission rates as a function of the hospital proportion of low- SES patients. Each hospital is represented by a separate point. Error bars represent 95% confidence intervals.
Official websites use .gov
A
.gov website belongs to an official
government organization in the United States.
Secure .gov websites use HTTPS
A lock (
) or https:// means you've safely
connected to the .gov website. Share sensitive
information only on official, secure websites.
Hospital 30-day readmission rates as a function of the hospital proportion of low- SES patients. Each hospital is represented by a separate point. Error bars represent 95% confidence intervals.