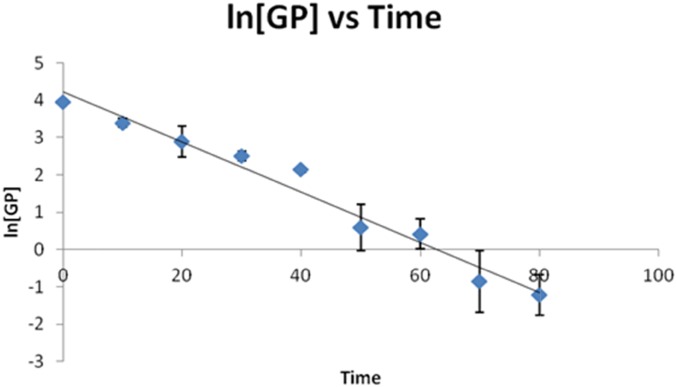
FIGURE 4.
The plot of ln[GP] vs. time for the IgG1 glycopeptide carrying the fucosylated glycan with 0 galactoses (H3N4F1). These data were obtained following the addition of PNGase F at a concentration of 2.5 U/μl. The [GP] signal was achieved by dividing the peak area of this glycopeptide by the integrated peak area of internal standard (GluFib) at each time point.

