Figure 4.
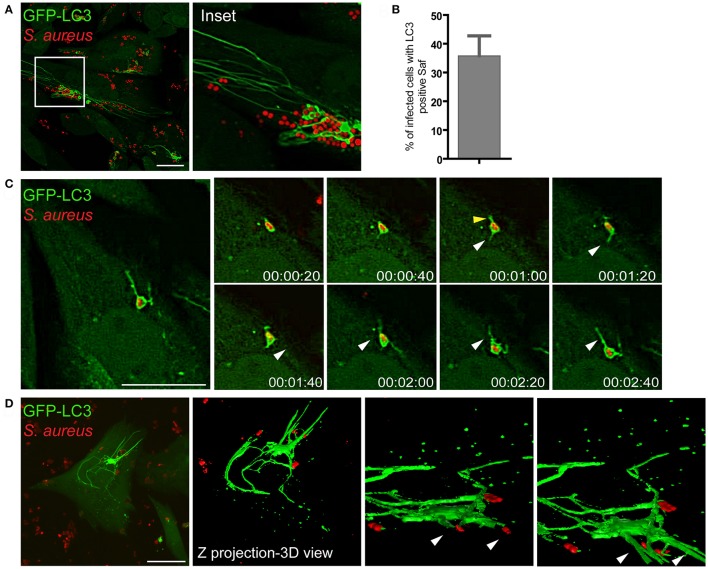
Saf membranes are decorated by the autophagic protein LC3. (A) CHO cells stably expressing GFP-LC3 were infected with rhodamine red labeled S. aureus for 1 h. (B) Quantification of the percentage of infected cells that presented Saf formation. Data show mean ± SEM of three independent experiments (n = 150 cells/condition). (C) Images show CHO living cells stably overexpressing GFP-LC3 infected with S. aureus for 1 h visualized by confocal microscopy. White arrowheads indicates a Saf emerging from the S. aureus-containing phagosome toward the perinuclear region and yellow arrowheads indicate Saf emerging toward the opposite direction. Relative time-points are expressed as h:min:s. (D) CHO cells stably expressing GFP-LC3 were infected with S. aureus wt for 1 h. Z stack images were processed using Image J to construct a 3D image. Bacteria were labeled with rhodamine-red. Scale bar: 20 μm.

