Figure 10.

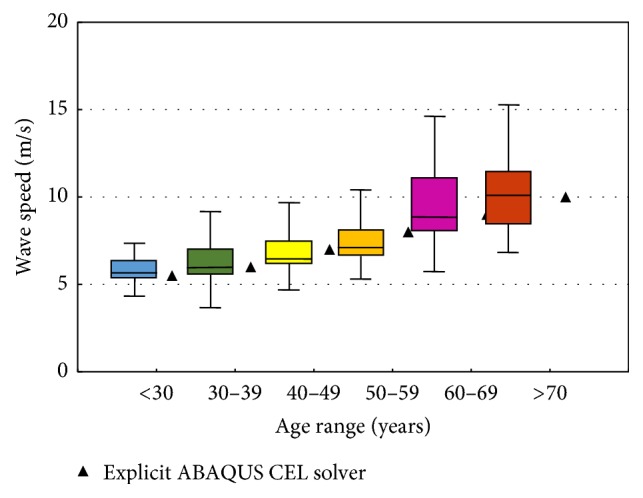
Normal values for PWV (average according to age (1455 subjects); boxes contain 50% of the data and bars contain the remainder; horizontal lines indicate medians) [16] plotted with the corresponding values obtained from our approach.

Normal values for PWV (average according to age (1455 subjects); boxes contain 50% of the data and bars contain the remainder; horizontal lines indicate medians) [16] plotted with the corresponding values obtained from our approach.