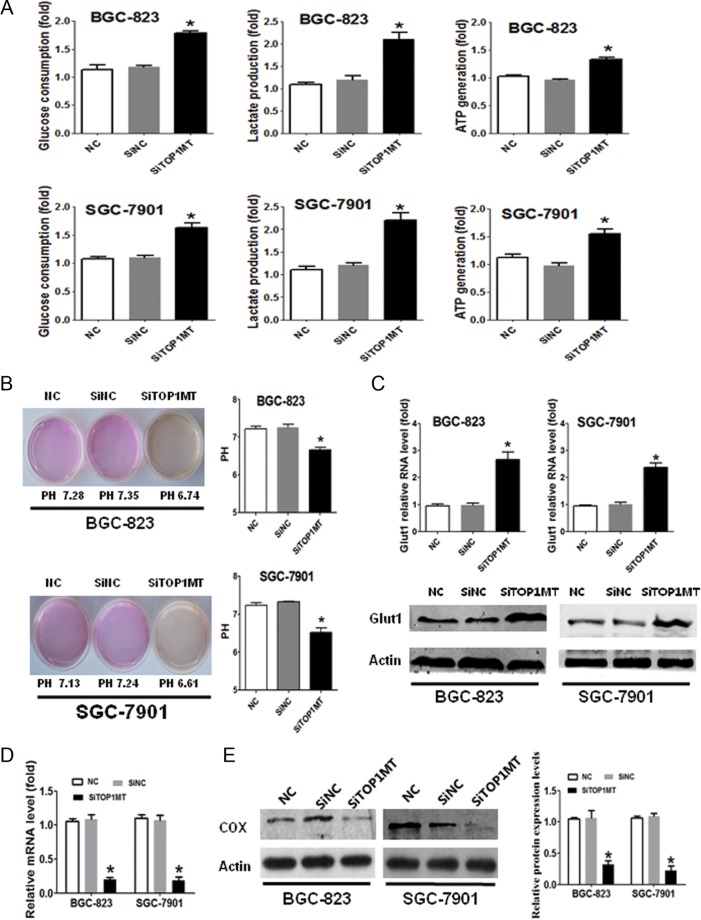
Figure 3.
TOP1MT silencing upregulated glucose consumption, lactate production and glucose transporter 1 in GC cells. (A) GC cells of NC, SiNC and SiTOP1MT groups were incubated for 48 h. Glucose uptake, lactate production and ATP generation in different groups of BGC-823 (A, upper) and SGC-7901 (A, lower) cells were measured using enzymatic methods or assay kits. (B) Representative experiments showing pH determination after 48 h of culture in NC, SiNC and SiTOP1MT groups. (C) Representative experiments showing glucose transporter 1 (Glut1) mRNA and protein expression, as examined by RT-PCR and Western blotting in NC, SiNC and SiTOP1MT groups. (D and E) Representative experiments showing cytochrome C oxidase (COX) mRNA (D) and protein expression (E), examined by RT-PCR and Western blotting in NC, SiNC and SiTOP1MT groups. *P < 0.05 in comparisons of the SiTOP1MT-transfected group with the SiNC or NC group. A full colour version of this figure is available at http://dx.doi.org/10.1530/ERC-17-0058.

 This work is licensed under a