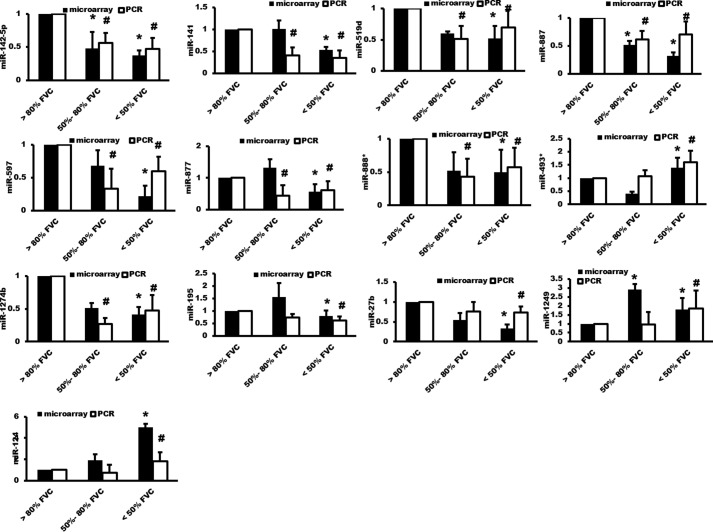
Figure 2.
Verification of the miRNA microarray data. miRNA microarray and real-time PCR were performed using total RNA isolated from the lung tissues of IPF patients. n = 10 for the <50% FVC group, n = 10 for the 50–80% FVC group, and n = 8 for the >80% predicted FVC group. Real-time PCR results were normalized to U6. Data were expressed as a ratio over the >80% FVC group. The results are presented as the mean ± S.E. *, p < 0.05 versus >80% FVC group in the microarray analysis. #, p < 0.05 versus >80% FVC group in the real-time PCR analysis.

