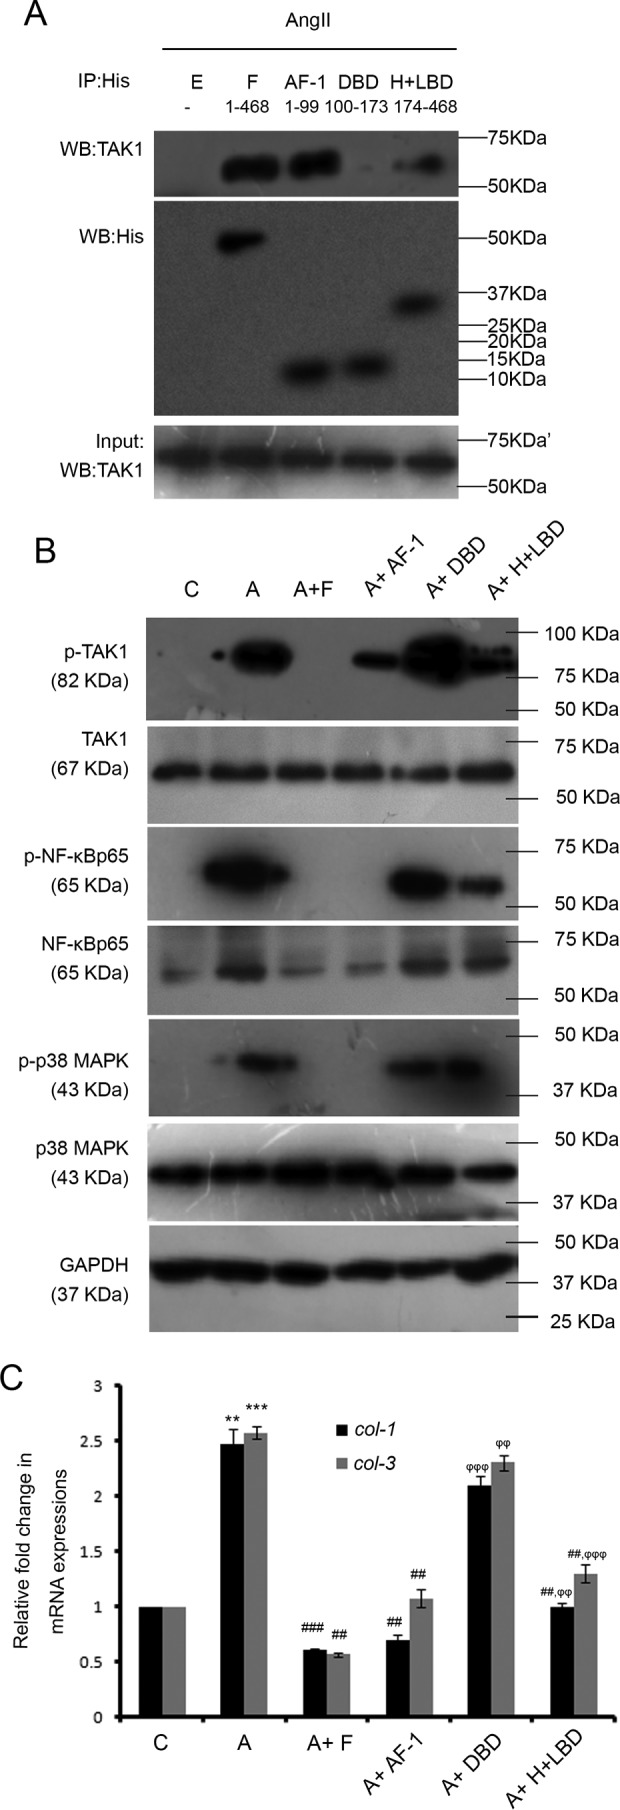
Figure 8.

Study of the effect of different PPARα domains upon PPARα-TAK1 interaction and their roles in modulation of non-canonical TGF-β pathway-induced collagen synthesis in hypertrophied fibroblasts. A, co-IP experiments were done by immunoprecipitating proteins with anti-His antibody followed by immunoblotting with anti-TAK1 antibody in vitro. Normalization was done by immunoblotting with anti-His antibody. Results were analyzed by ANOVA followed by Tukey's post hoc test and expressed as ±S.E. of three independent experiments. n = 5 for each group. E, empty pCDNA6/V5 HisB vector; F, full-length PPARα plasmid; AF-1, PPARα N-terminal transactivation domain plasmid; DBD, PPARα DNA-binding domain; H + LBD, PPARα combined Hinge region+ C-terminal ligand-binding domain plasmid. All the plasmids were transfected into AngII-treated fibroblasts. n = 5 for each group. B, Western blot (WB) analyses showing alterations in expression levels of phospho/total TAK1, NF-κBp65, and p38 MAPK in AngII-treated cells transfected with full-length or individual domains of PPARα plasmids compared with AngII-treated fibroblasts. GAPDH was used as internal loading control. C, control fibroblasts; A, AngII-treated fibroblast; A + F, full-length PPARα transfected AngII-treated fibroblasts; A + AF-1, PPARα N-terminal transactivation domain transfected AngII-treated cells; A + DBD, PPARα DNA-binding domain transfected AngII-treated cells; A + H + LBD, PPARα combined Hinge region+ C-terminal Ligand-binding domain transfected AngII-treated cells. C and A cells were also treated with empty pCDNA6/V5 HisB vector. n = 5 for each group. C, graphical representation of qRT-PCR analyses showing changes in levels of col-1 and col-3 gene expressions in AngII-treated cells transfected with full-length or individual domains of PPARα plasmids compared with AngII-treated fibroblasts. Rpl-32 was used as internal loading control. Results were analyzed by ANOVA followed by Tukey's post hoc test and expressed as ±S.E. of three independent experiments. C, control fibroblasts; A, AngII-treated fibroblast; A + F, full-length PPARα transfected AngII-treated cells; A + AF-1, PPARα N-terminal transactivation domain transfected AngII-treated cells; A + DBD, PPARα DNA-binding domain transfected AngII-treated cells; A + H + LBD, PPARα combined Hinge region+ C-terminal ligand-binding domain transfected AngII-treated cells. C and A cells were also treated with empty pCDNA6/V5 HisB vector. n = 5 for each group. **, p < 0.01 with respect to control cells; ***, p < 0.001 with respect to C; ##, p < 0.01 with respect to A; ###, p < 0.001 with respect to A; ϕϕ, p < 0.01 with respect to A + F; ϕϕϕ, p < 0.001 with respect to A + F.
