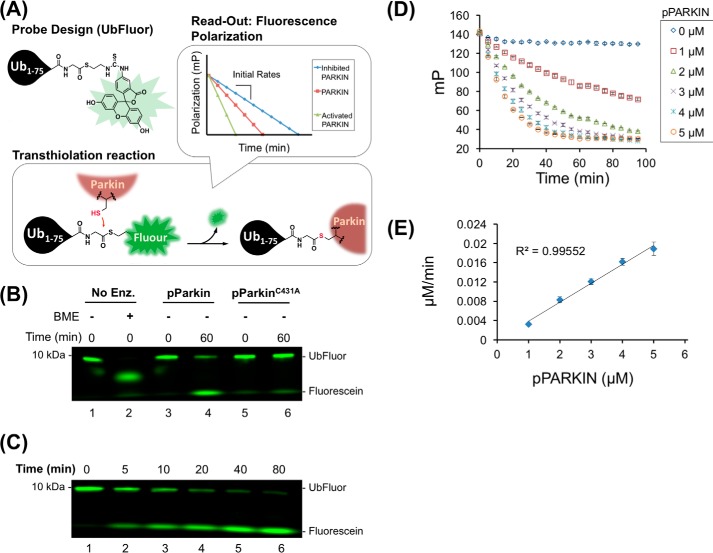
Figure 3.
UbFluor reports pPARKIN activity in real time by fluorescence polarization. A, design of the ByS reaction using UbFluor and PARKIN. B, BME (lane 2) or pPARKIN (lane 4) can release free fluorescein (SFluor) from UbFluor but not pPARKINC431A (lane 6). C, gel-based analysis of UbFluor/pPARKIN reaction. At the indicated time points, the reaction was stopped by addition of non-reducing Laemmli buffer and analyzed by SDS-PAGE. A time-dependent decrease in the intensity of the UbFluor band and an increase in the free fluorescein band were observed. D, FP-based analysis of UbFluor (0.5 μm) consumption by the indicated amount of pPARKIN (0–5 μm). Mean ± S.E. of three measurements for each concentration of pPARKIN are shown. E, plot of the initial rates (0–5 min) from D showing that the rate of UbFluor consumption increases linearly with pPARKIN concentration (R2 = 0.996).

