
Figure 4.
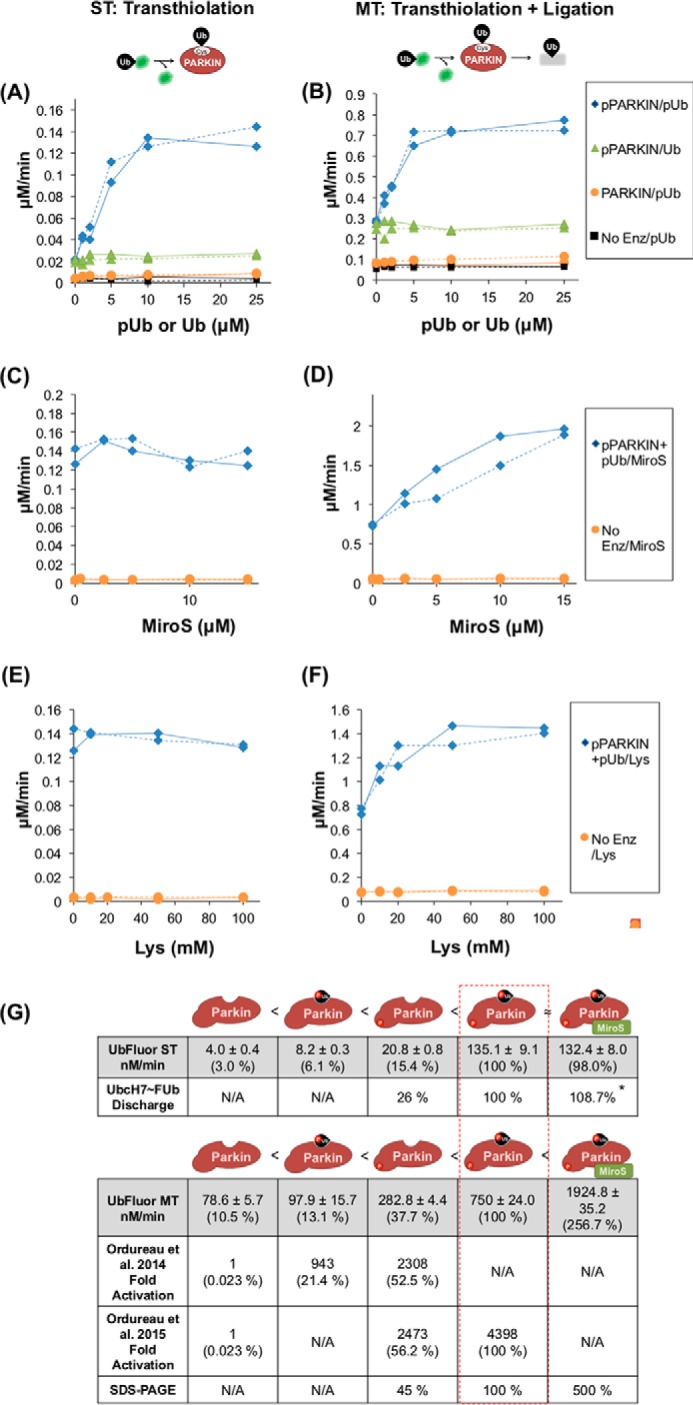
UbFluor confirms multiple activation states of PARKIN. Titrations in the left panels (A, C, and E) were performed under ST conditions (5 μm PARKIN, 0.5 μm UbFluor), and the right panels (B, D, and F) were performed under MT conditions (2 μm PARKIN, 20 μm UbFluor). Each titration was repeated twice, and all data are shown. Solid lines join the rates determined from one titration experiment, and dashed lines join rates determined from a second titration. A and B, Ub or pUb titration into a UbFluor reaction with PARKIN or pPARKIN. C and D, MiroS titration into pPARKIN + 25 μm pUb. E and F, lysine titration into pPARKIN + 25 μm pUb. G, comparison of PARKIN activation measured using UbFluor with previous data. UbFluor measurements under ST and MT conditions and SDS-PAGE-based quantification are reported in this work. AQUA-MS data were reported in by Ordureau et al. (7, 8). For comparison of UbFluor to AQUA-MS, the maximal rate corresponding to each state is determined as a percentage of pPARKIN + pUb activity. Schematics depict the relative activity of each PARKIN species, with unmodified PARKIN having the lowest activity and pPARKIN + pUb + MiroS having the highest. N/A, not applicable. * rate was too fast to accurately resolve.