
Figure 5.
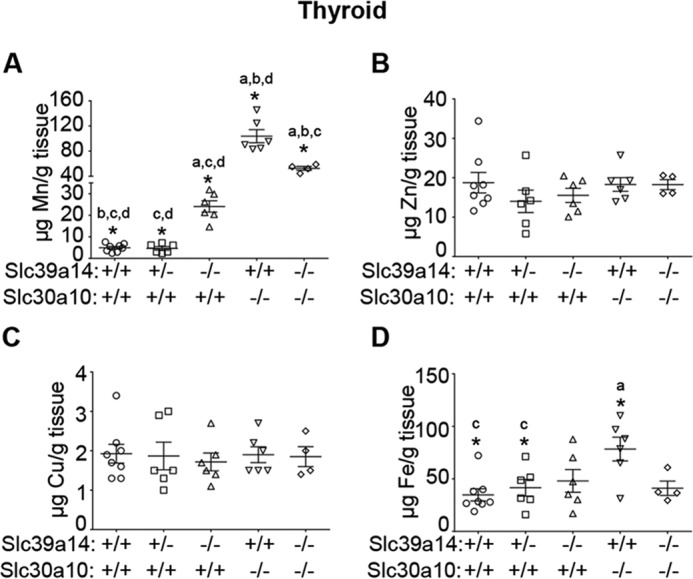
Measurement of metal levels in the thyroid gland. A–D, absolute metal levels in the thyroid of 6-week-old mice of indicated genotypes were measured using inductively coupled plasma mass spectrometry (n = 8 WT, 6 males and 2 females (Slc30a10+/+/Slc39a14+/+); 6 Slc39a14 heterozygous, 2 males and 4 females (Slc30a10+/+/Slc39a14+/−); 6 Slc39a14 single knockout, 3 males and 3 females (Slc30a10+/+/Slc39a14−/−); 6 Slc30a10 single knockout, all males (Slc30a10−/−/Slc39a14+/+); and 4 Slc30a10/Slc39a14 double knockout, 3 males and 1 female (Slc30a10−/−/Slc39a14−/−); *, p < 0.05 using one-way ANOVA and Tukey–Kramer post hoc test, with a, b, c, and d indicating differences in comparison with WT, Slc39a14 single, Slc30a10 single, or Slc30a10/Slc39a14 double knockouts, respectively; horizontal lines indicate mean; errors bars indicate ± S.E.).