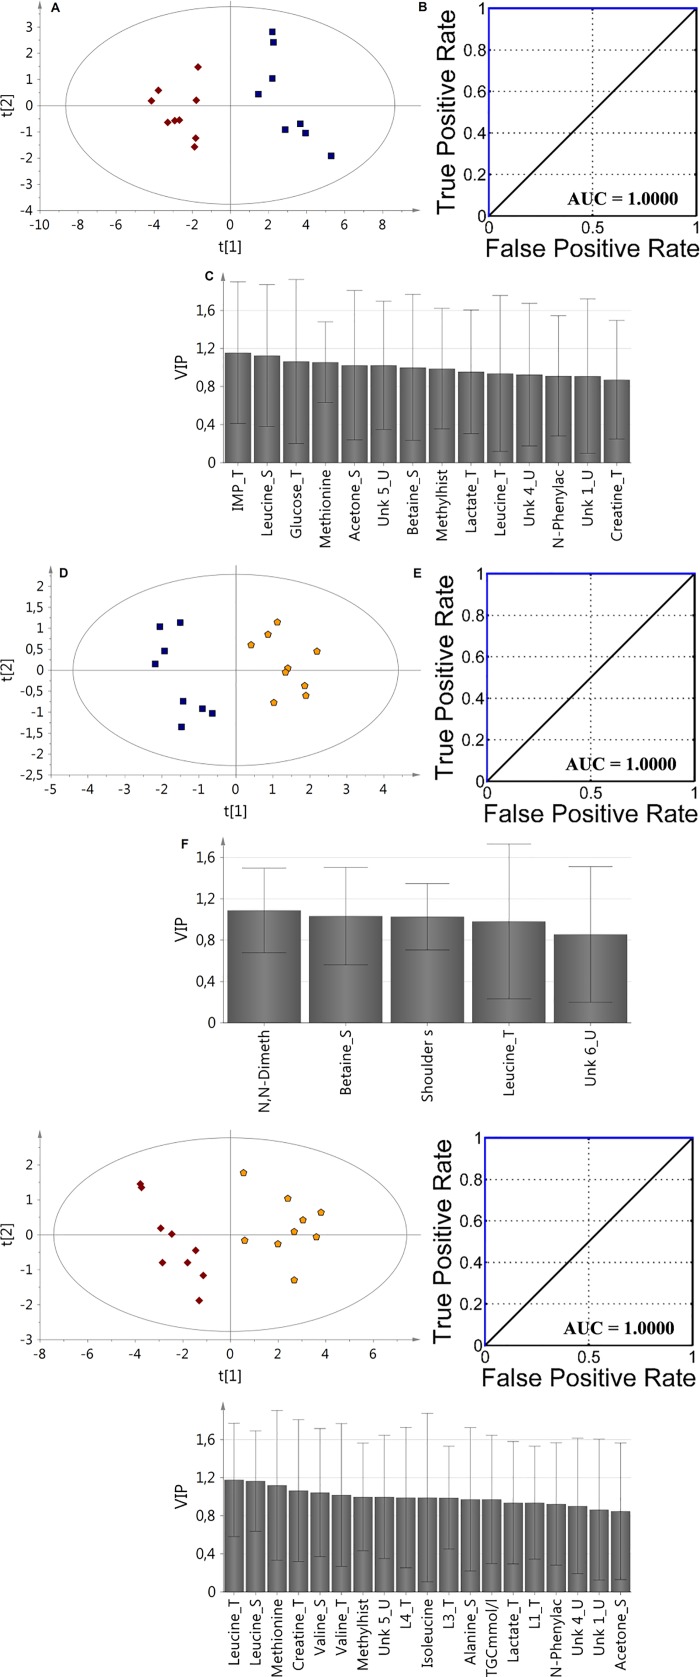
Fig 4.
The VIP-PLS-DA model ROC curve and AUC values obtained for fusion data samples based on selected variables according to the VIP plots with the jackknife confidence interval: A,B,C (BDG vs. RG); D,E,F (RG vs. UDG); G, H, I (BDG vs. UDG). Red diamonds—balanced diet group (BDG); blue boxes—regression group (RG); yellow pentagons—unbalanced diet group (UDG).

