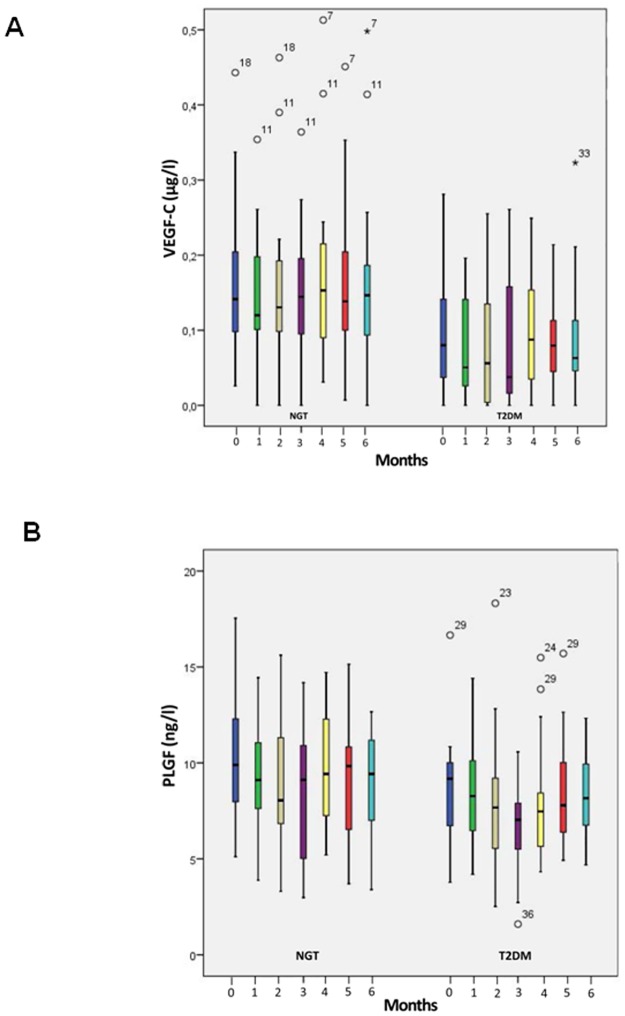
Fig 3.
A) Boxplots of VEGF-C concentrations in plasma of subjects with normal glucose tolerance (NGT) and patients with type 2 diabetes mellitus (T2DM) over an observation period of 6 months B) Boxplots of PLGF concentrations in plasma of subjects with normal glucose tolerance (NGT) and patients with type 2 diabetes mellitus (T2DM) over an observation period of 6 months. The lower border of the box plots represent the 25th percentile and the upper border represents the 75th percentile ± SD. ° = patient with a value < 3 times box size, * = patient with a value ≥ 3 times box size. Number above °/* = reflects individual patient number.

