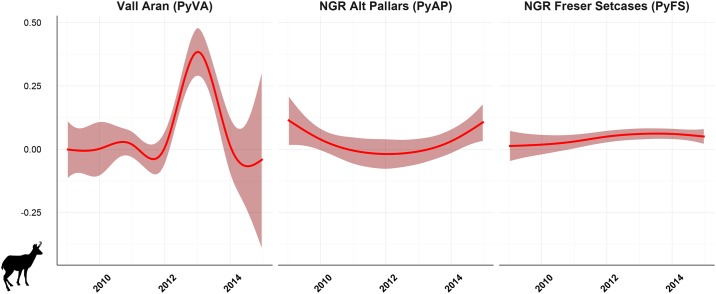
Fig 2. Modeled trend curves of Mycoplasma conjunctivae infection in Pyrenean chamois by generalized additive models.
Infection indices show evident curve differences by study area, in which the interaction of year with the study area resulted statistically significant in NGR Alt Pallars and Vall Aran, but not in NGR Freser Setcases.

