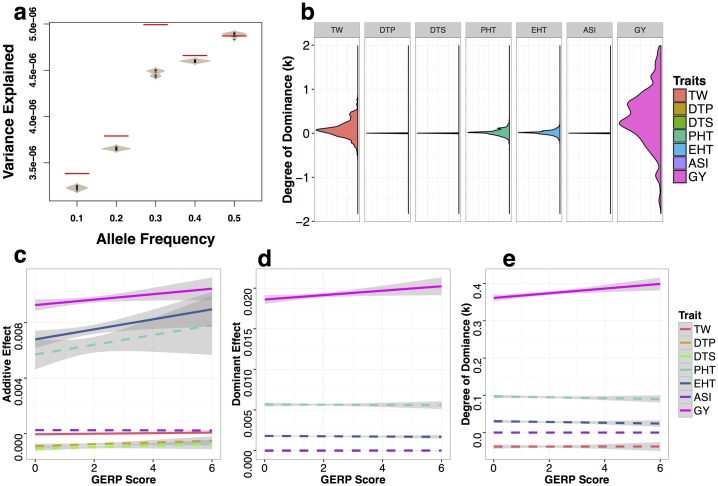
Fig 2. Variance explained and degree of dominance (k) of GERP-SNPs for traits per se.
(a) Total per-SNP variance explained for grain yield trait per se by GERP-SNPs (red lines) and randomly sampled SNPs (grey beanplots). (b) Density plots of the degree of dominance (k). Extreme values of k were truncated at 2 and -2. (c-e) Linear regressions of additive effects (c), dominance effects (d), and degree of dominance (e) of seven traits per se against SNP GERP scores. Solid and dashed lines represent significant and nonsignificant linear regressions, with grey bands representing 95% confidence intervals. Data are only shown for SNPs that explain more than the mean genome-wide per-SNP variance (see Methods for details).

