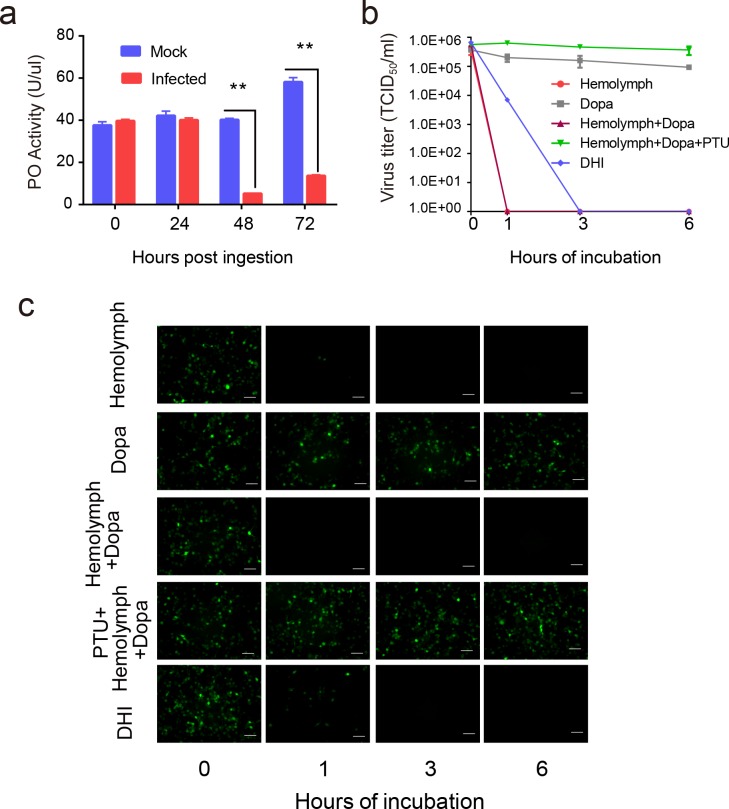
Fig 2. The relationship between baculovirus infection and melanization.
(a) Comparison of PO activity of 1 μL hemolymph in mock-infected and infected H. armigera (n = 6) at four time points (0, 24, 48 and 72 hpi). The hemolymph were collected and exposed for 30 min to trigger spontaneous PPO activation. The PO activity levels of infected hemolymph significantly declined at 48 and 72 hpi. Values are expressed as mean ± s.e.m of six independent experiments. Statistical significance was determined using a two-tailed Student’s t-tests. * p ≤ 0.05, ** p ≤ 0.01. (b) The virus titer analysis of baculovirus with different treatments. HearNPV-egfp was mixed with either hemolymph, dopa, hemolymph and dopa, hemolymph and dopa with PTU, or DHI. These mixtures were incubated at room temperature for 0, 1, 3, or 6 h, and were quantified for production of infectious BV by end-point dilution assay. Data points represent average titers from triplicate infections. Error bars represent standard errors. (c) HearNPV-egfp, with different treatments as described above were directly used to infect HzAM1 cells. Fluorescence microscopy images were taken at 72 hpi to observe the viability of baculovirus. Scale bars represent 100 μm.

