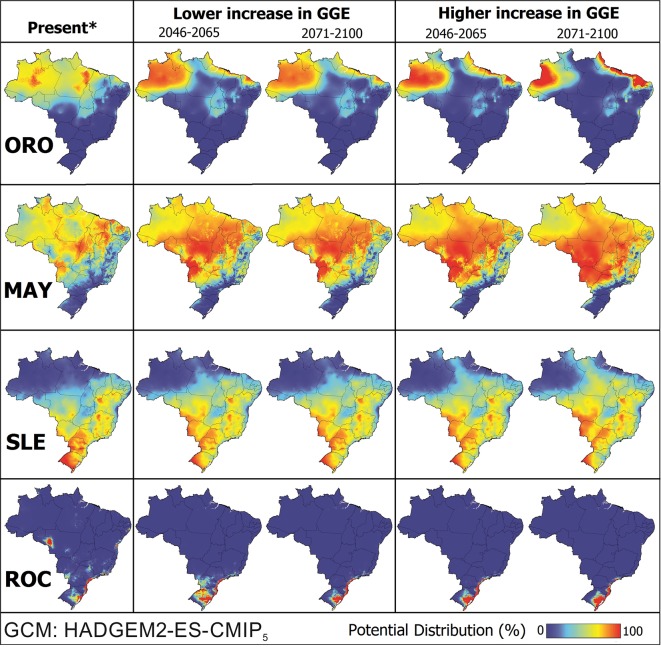
Fig 5. Predicted ORO, MAY, SLE and ROC range expansion in Brazil based on GCM HadGEM2-ES.
The maps show the distribution under two climate change scenarios: RCP 2.6 (lower increase in greenhouse gas emissions) and RCP 8.5 (higher increase in greenhouse gas emissions). The maps were built using QGis software 2.10.1. *”Present” is the scenario in which disease outbreaks have been described, based on 1950–2010 climate data.

