Figure 6.

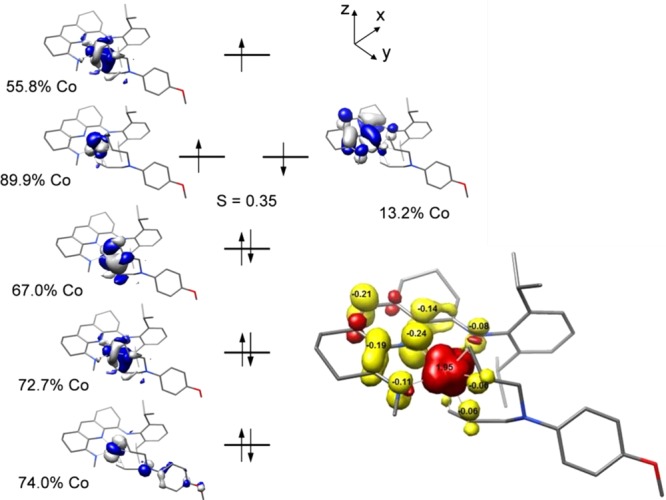
(left) Qualitative molecular orbital diagram for 8 from a BS(2,1) calculation at the B3LYP level. (right) Spin density plot obtained from Mulliken population analysis (red, positive spin density; yellow, negative spin density).

(left) Qualitative molecular orbital diagram for 8 from a BS(2,1) calculation at the B3LYP level. (right) Spin density plot obtained from Mulliken population analysis (red, positive spin density; yellow, negative spin density).