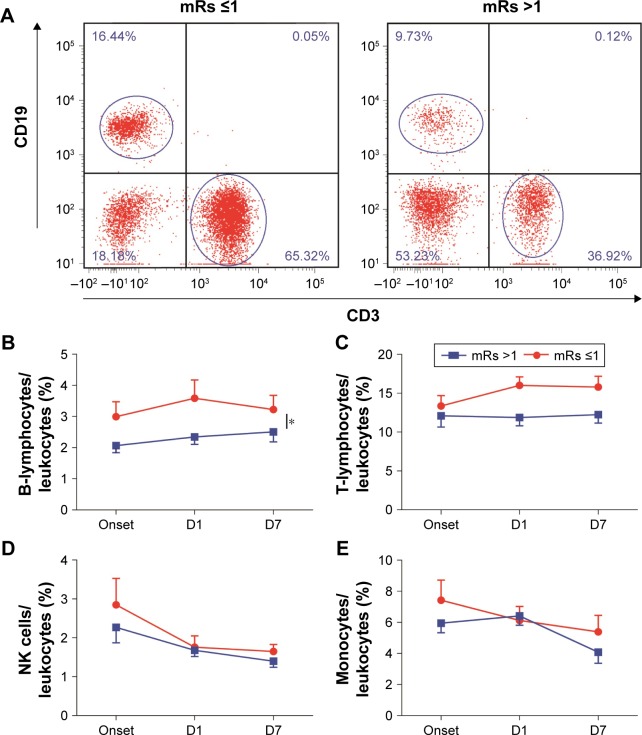
Figure 3.
Associations between mRs and leukocyte subset percentages.
Notes: Patients were divided into two groups based on their mRs (mRs ≤1 and mRs >1). The percentages of B- and T-lymphocytes over time were compared between two groups. The frequencies of B-lymphocytes and T-lymphocytes in well-recovered patients were higher than those in poorly recovered patients. (A) Representative flow cytometry plot of B- and T-lymphocytes in peripheral blood for patients in mRs ≤1 and mRs >1 groups. (B) The percentages of B-lymphocytes in the mRs ≤1 group were much higher than those in the mRs >1 group within 7 days after stroke. (C) The percentages of T-lymphocytes in the mRs ≤1 group were much higher than that in the mRs >1 group within 7 days after stroke. (D) Percentages of NK cells showed no difference between the two groups. (E) Percentages of monocytes showed no difference between the two groups. D1, first day; D7, seventh day. *P<0.05 by two-way ANOVA.
Abbreviations: mRs, modified Rankin scale; ANOVA, analysis of variance.

