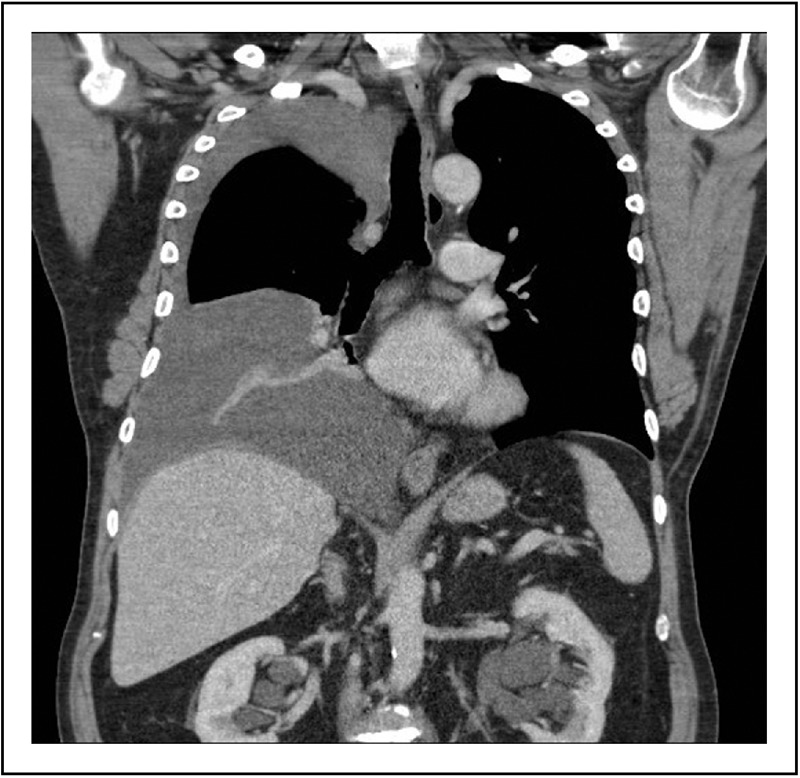
FIGURE 3.

Computed tomography scan (coronal view) shows the right diaphragm that is pushed down by a moderate pleural effusion to a level lower than the left diaphragm. It shows the effect of the weight of fluid on the diaphragm even when the patient is in the supine position. This is likely to be worse when the patient is in an upright position.
