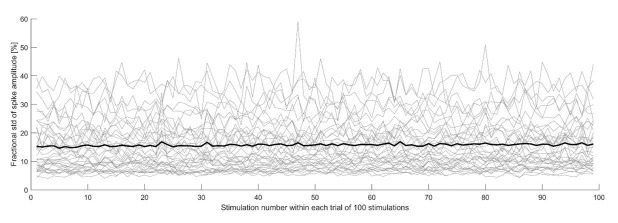
Author response image 2. Fractionalamplitude variability as a function of stimulation number.
The plot shows the standard deviation of the spike amplitude, divided by the spike amplitude for each electrode, of the neuron shown in Figure 5 of the main text.

