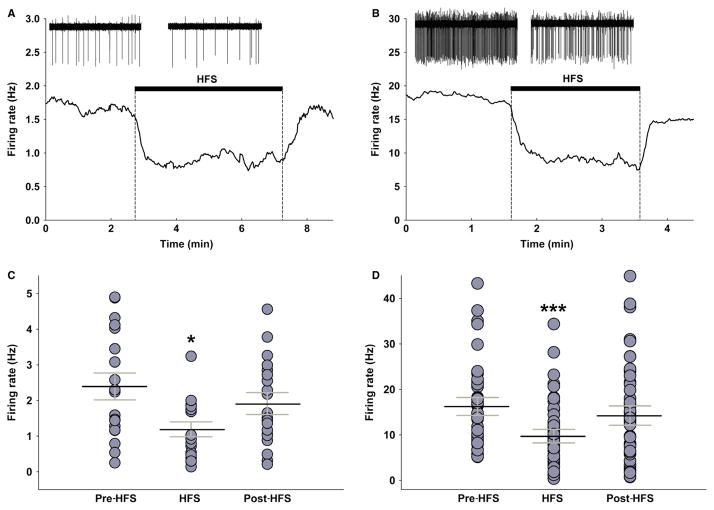
Fig. 4.
Examples of slow-firing (A) and fast-firing (B) cells before, during and after HFS. Insets are 30-s segments of raw waveforms illustrating the change in spiking frequency. Note a significant decrease in firing rate during HFS and a recovery to baseline levels in both slow and fast neurons. Bottom graphs are vertical plots of all slow (C) and fast (D) neurons before, during and after HFS. Black lines in the middle of each group indicate mean firing rate, while grey lines are error bars (SEM). Note a significant decrease in firing rate during HFS in both slow (P < 0.05, n = 29) and fast neurons (P < 0.001, n = 73). *P < 0.05, ***P < 0.001.

