Fig. 2.
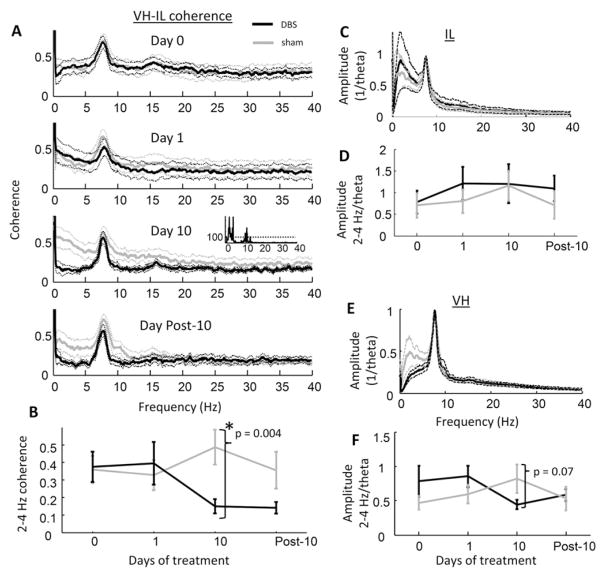
LFP coherence and amplitude across days. A) Coherence spectra for VH and IL LFP recordings for DBS-treated rats (black) and sham-treated animals (gray) during the spontaneous behavior epochs on days 0, 1, 10, and post-10 (top to bottom panels; mean ± s.e.m.). Inset in Day 10 panel shows the inverse of the statistical probability (1/p) that values from both groups were sampled from the same distribution, dashed horizontal line is the 99% confidence interval. A robust effect of DBS was observed only after 10 days of treatment in the 2–4 Hz range. B) Difference between 2–4 Hz, VH-IL coherence across days of treatment (error bars are s.e.m.). C) LFP spectral density in the IL, relative to the maximum amplitude within the 6 to 10 Hz (theta) band, following 10 days of treatment. No differences were observed in relative signal amplitude between DBS- and sham-treated animals at any frequency bin. D) Amplitude of 2–4 Hz-to-theta LFP signals in the IL across treatment days. E & F) As in C & D respectively, but for VH. In contrast with IL, rats treated with sham stimulation appeared to have stronger 2–4 Hz patterns than DBS-treated rats after 10 days of treatment.

