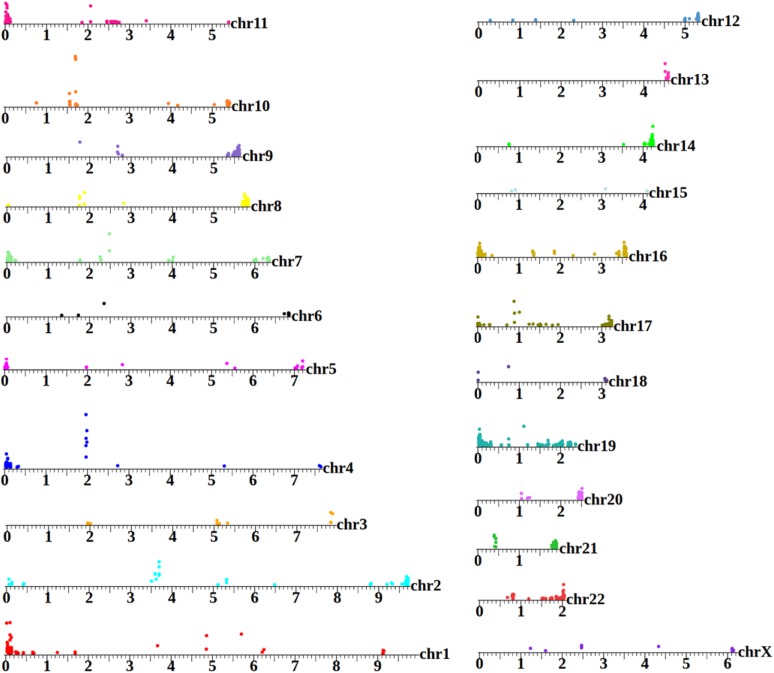
Figure 4.
A human extrachromosomal circular DNA (eccDNA) map. GA12878 is the canonical cell line used by the National Institutes of Standards and Technology as a benchmark for high-throughput genome analysis (Zook et al. 2014). However, to date, published analysis of this sample to has been focused on the linear genome. This map shows areas on each chromosome that are significantly enriched in the circular pool (25-kbp intervals with enrichment assessed through Bayes maximum-likelihood). Position of the colored circle on the y-axis for each interval is proportional to the degree of enrichment. The eccDNA profile of each chromosome is distinctive, with enriched regions aligning to coding segments, repetitive, and subtelomeric sequences. This plot shows only reads that map uniquely to the genome.

