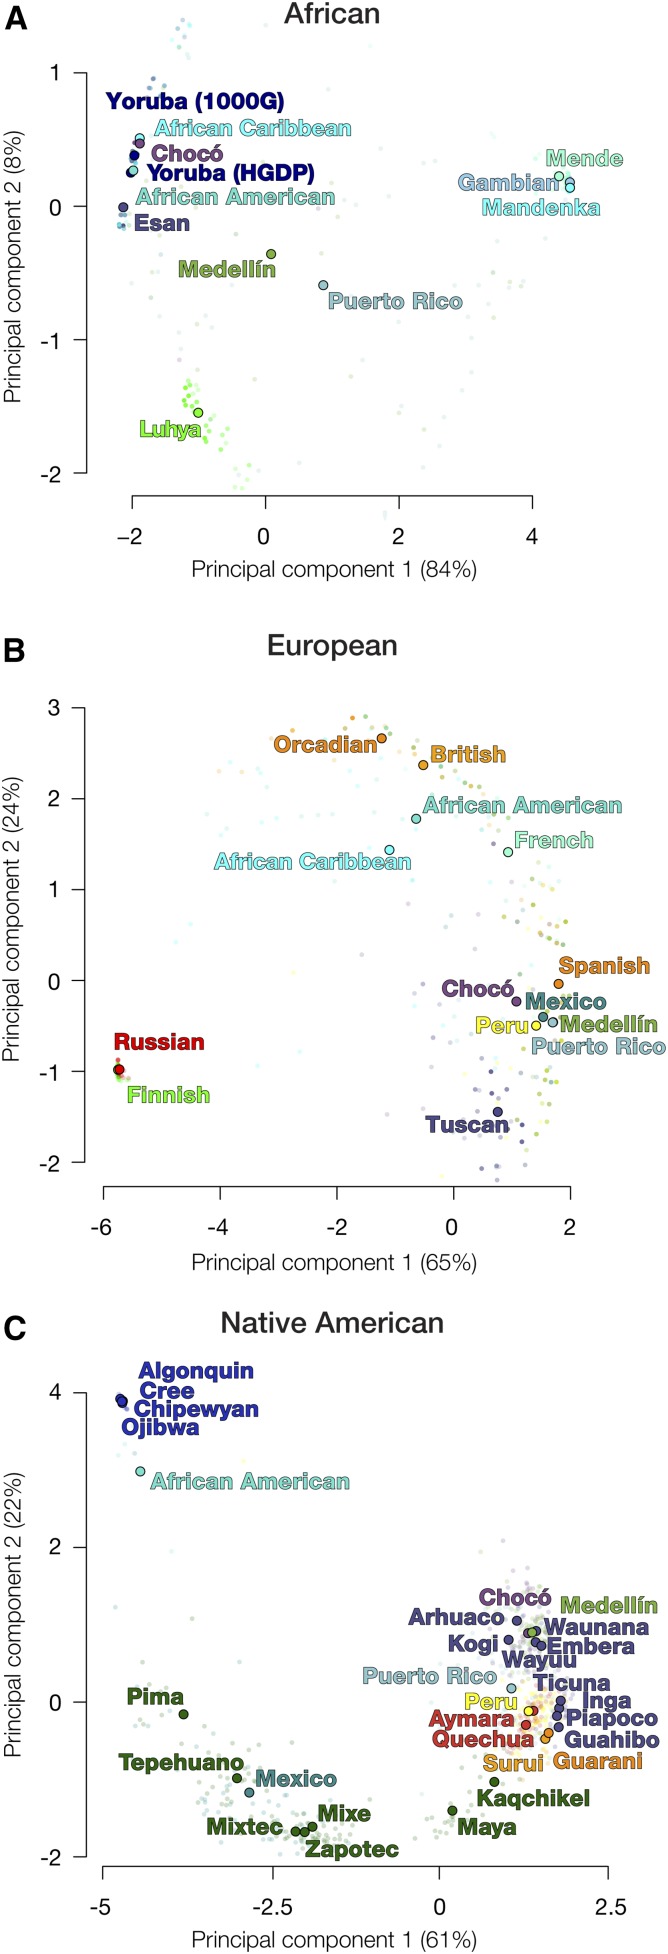
Figure 4.
Ancestry-specific principal component analysis (PCA) for admixed American and global reference populations. PCAs are shown separately for (A) African, (B) European, and (C) Native American ancestry fractions. The locations of the dots correspond to population-specific centroids estimated from all individuals within each population. Population descriptions can be found in Table 1.

