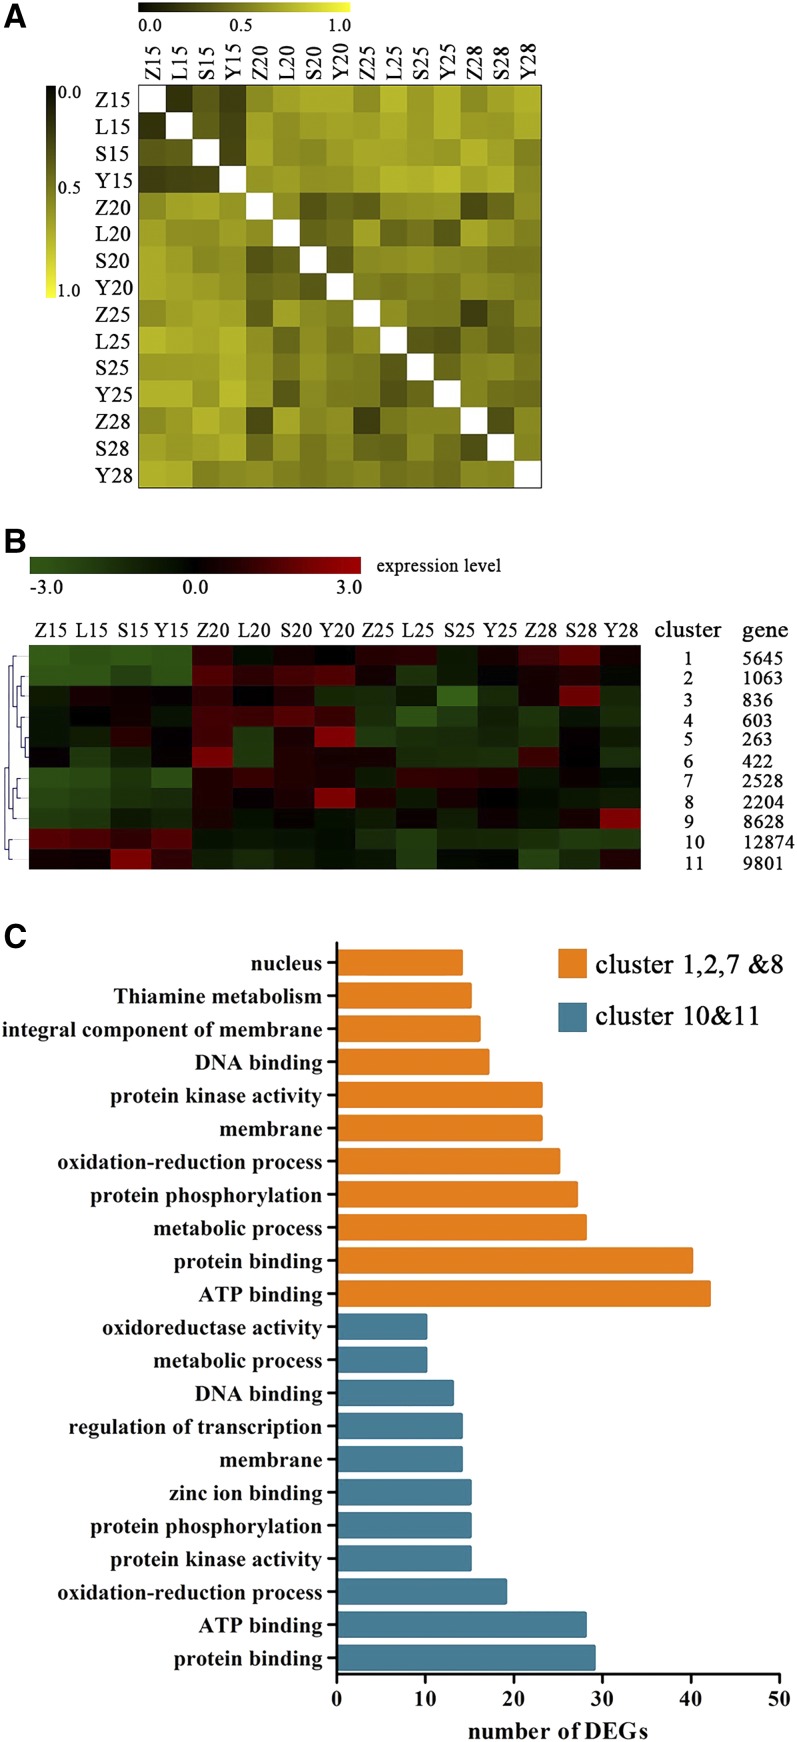
Figure 1.
Statistical analysis of transcript profiling data. Z, S, L, and Y indicate CCRI45, MBI7561, MBI7747, and MBI7285, respectively. 15, 15 DPA; 20, 20 DPA; 25, 25 DPA; and 28, 28 DPA. (A) Pearson correlation coefficients of all samples. (B) Self-Organizing Tree Algorithm clustering of all genes across all samples. (C) Functional annotations of genes in more highly expressed at 15 DPA than later (orange bars) and those more highly expressed at 28 DPA than earlier (blue bars). DEG, differentially-expressed gene; DPA, days postanthesis.

