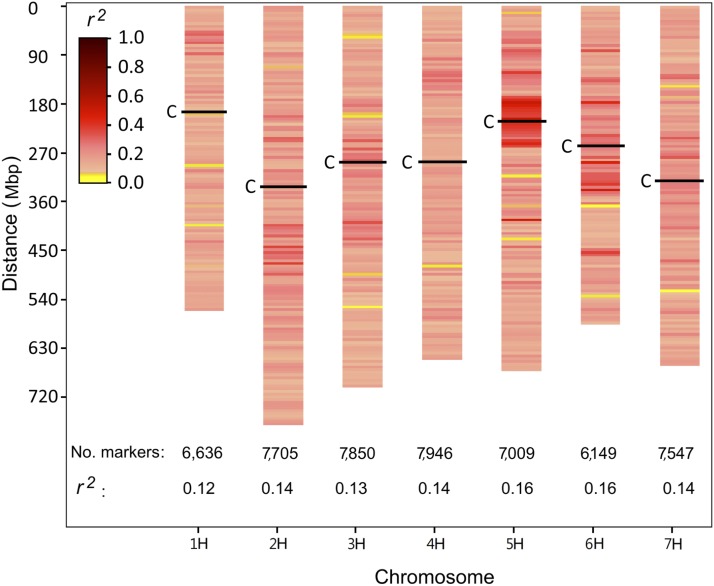
Figure 1.
Heatmap for the distribution of linkage disequilibrium (LD) across the genome of H. vulgare subsp. spontaneum accessions of the WBDC estimated as r2 using SNP markers, number of SNP markers for each chromosome, and average adjacent marker LD for each chromosome. The approximate positions of centromeres (C) are given for each chromosome.

