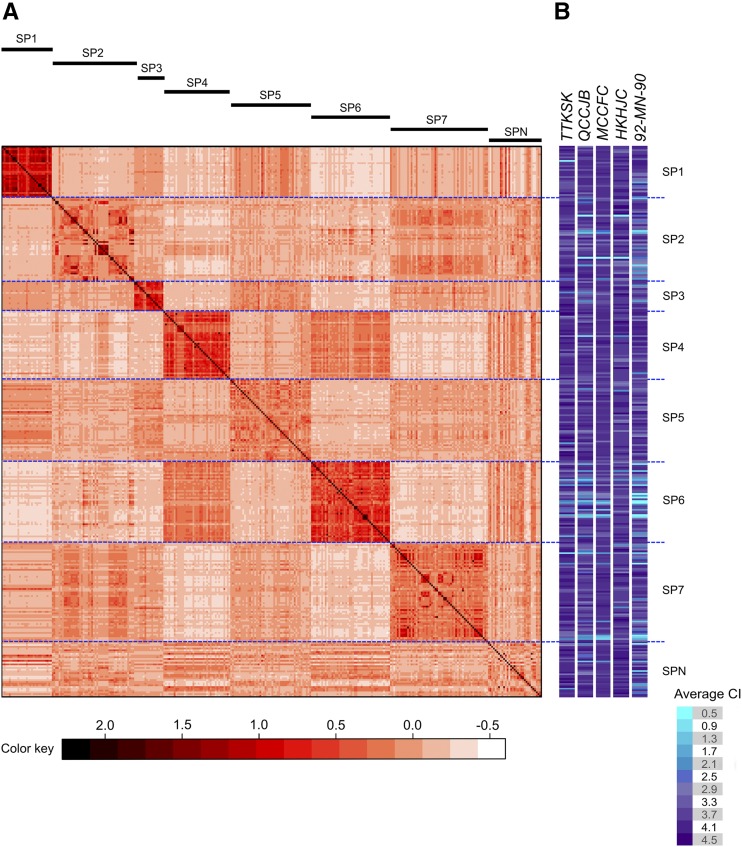
Figure 3.
(A) Heatmap matrix displaying the genetic kinship among accessions of the WBDC calculated based on 50,842 SNP markers with corresponding subpopulations identified by STRUCTURE given above. (B) Heatmap for the average coefficient of infection (CI) of WBDC accessions to P. graminis f. sp. tritici pathotypes TTKSK, QCCJB, MCCFC, and HKHJC and P. graminis f. sp. secalis culture 92-MN-90 where lighter colors indicate higher resistance levels.

