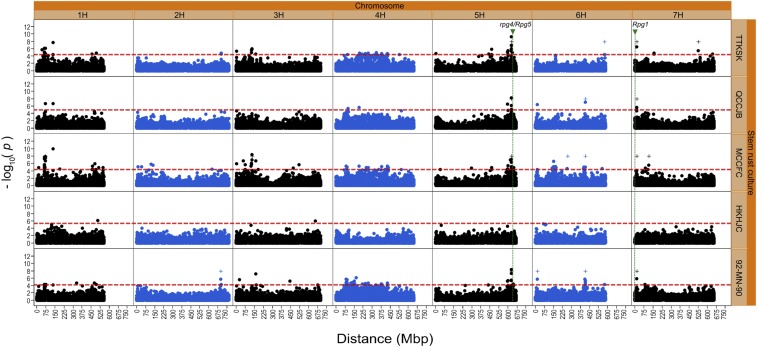
Figure 6.
Manhattan plot displaying SNP markers significantly associated with resistance to four P. graminis f. sp. tritici pathotypes (TTKSK, QCCJB, MCCFC, and HKHJC) and one P. graminis f. sp. secalis culture 92-MN-90 in the WBDC. Two models were used: the K model (designated by circles) and the G model [designated by plus (+) signs]. All plotted G model hits are significant. The threshold for QTL detection for each P. graminis culture using the K model is shown with a horizontal dashed red line. Physical positions of the stem rust resistance genes Rpg1 and rpg4/Rpg5 are given on the map.

