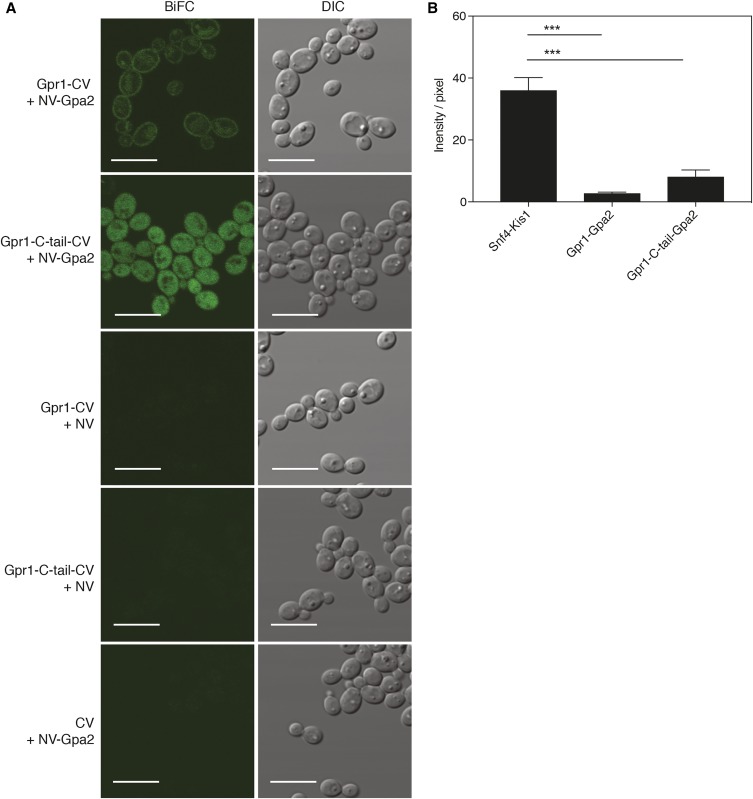
Figure 4.
(A) Representative BiFC images showing in vivo interaction of Gpr1-CV + NV-Gpa2, the C-tail of Gpr1 and Gpa2, and control strains expressing Gpr1-CV + NV, Gpr1-C-tail-CV + NV, and CV + NV-Gpa2. Bar is 10 µm. (B) Quantification of fluorescence intensity per pixel of Snf4-Kis1, Gpr1-Gpa2, and Gpr1-C-tail-Gpa2 strains. Analysis of fluorescence intensity was done with original images using the same acquisition settings of the microscope. Data represent mean values ± SEM (n = 3; ±60 cells per replicate). *Significant difference (one-way ANOVA, Tukey’s multiple comparison test, *** P ≤ 0.001).

