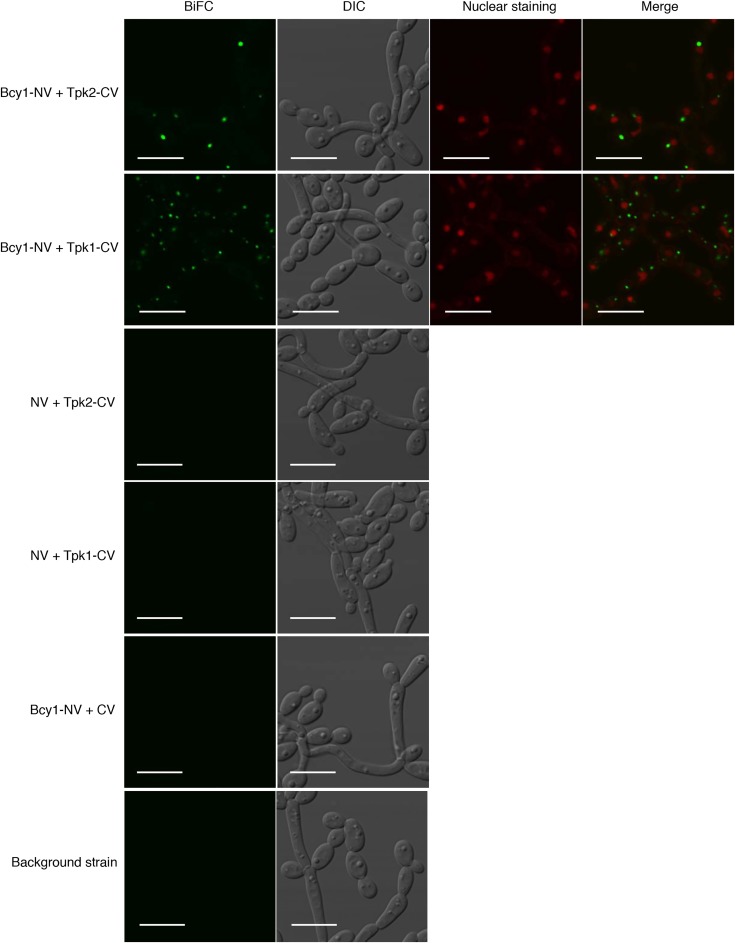
Figure 5.
Representative BiFC images showing in vivo interaction of Bcy1-NV + Tpk1-CV, Bcy1-NV + Tpk2-CV with nuclear staining, controls strains expressing Bcy1-NV + CV, NV + Tpk1-CV, NV + Tpk2-CV, and the background strain. Images are taken in the exponential phase of growth in SC-Met-Cys 2% glucose at 37°. Bar is 10 µm.

